
We travel to see the world, but we track our travels to remember it. For years, I relied on TripIt to keep my travel history organized. But the API is no longer available and in their UI is hard to find older trips and get cool stats and visualizations.
Instead of losing that history, I spent a recent holiday afternoon building a custom solution: a TripIt Data Visualization site.
The initial motivation was simple: data ownership. I knew I could still get a JSON export of my data (thanks to GDPR), but a JSON file isn’t exactly “visual.”
🌍 See it in Action (Try the Sample Data)
You don’t need your own data export to see how it works. I’ve included a “Sample Data” mode so anyone can explore the dashboard immediately.
👉 Check out the demo here: tripit.csanchez.org
The Goal: Beyond the Itinerary
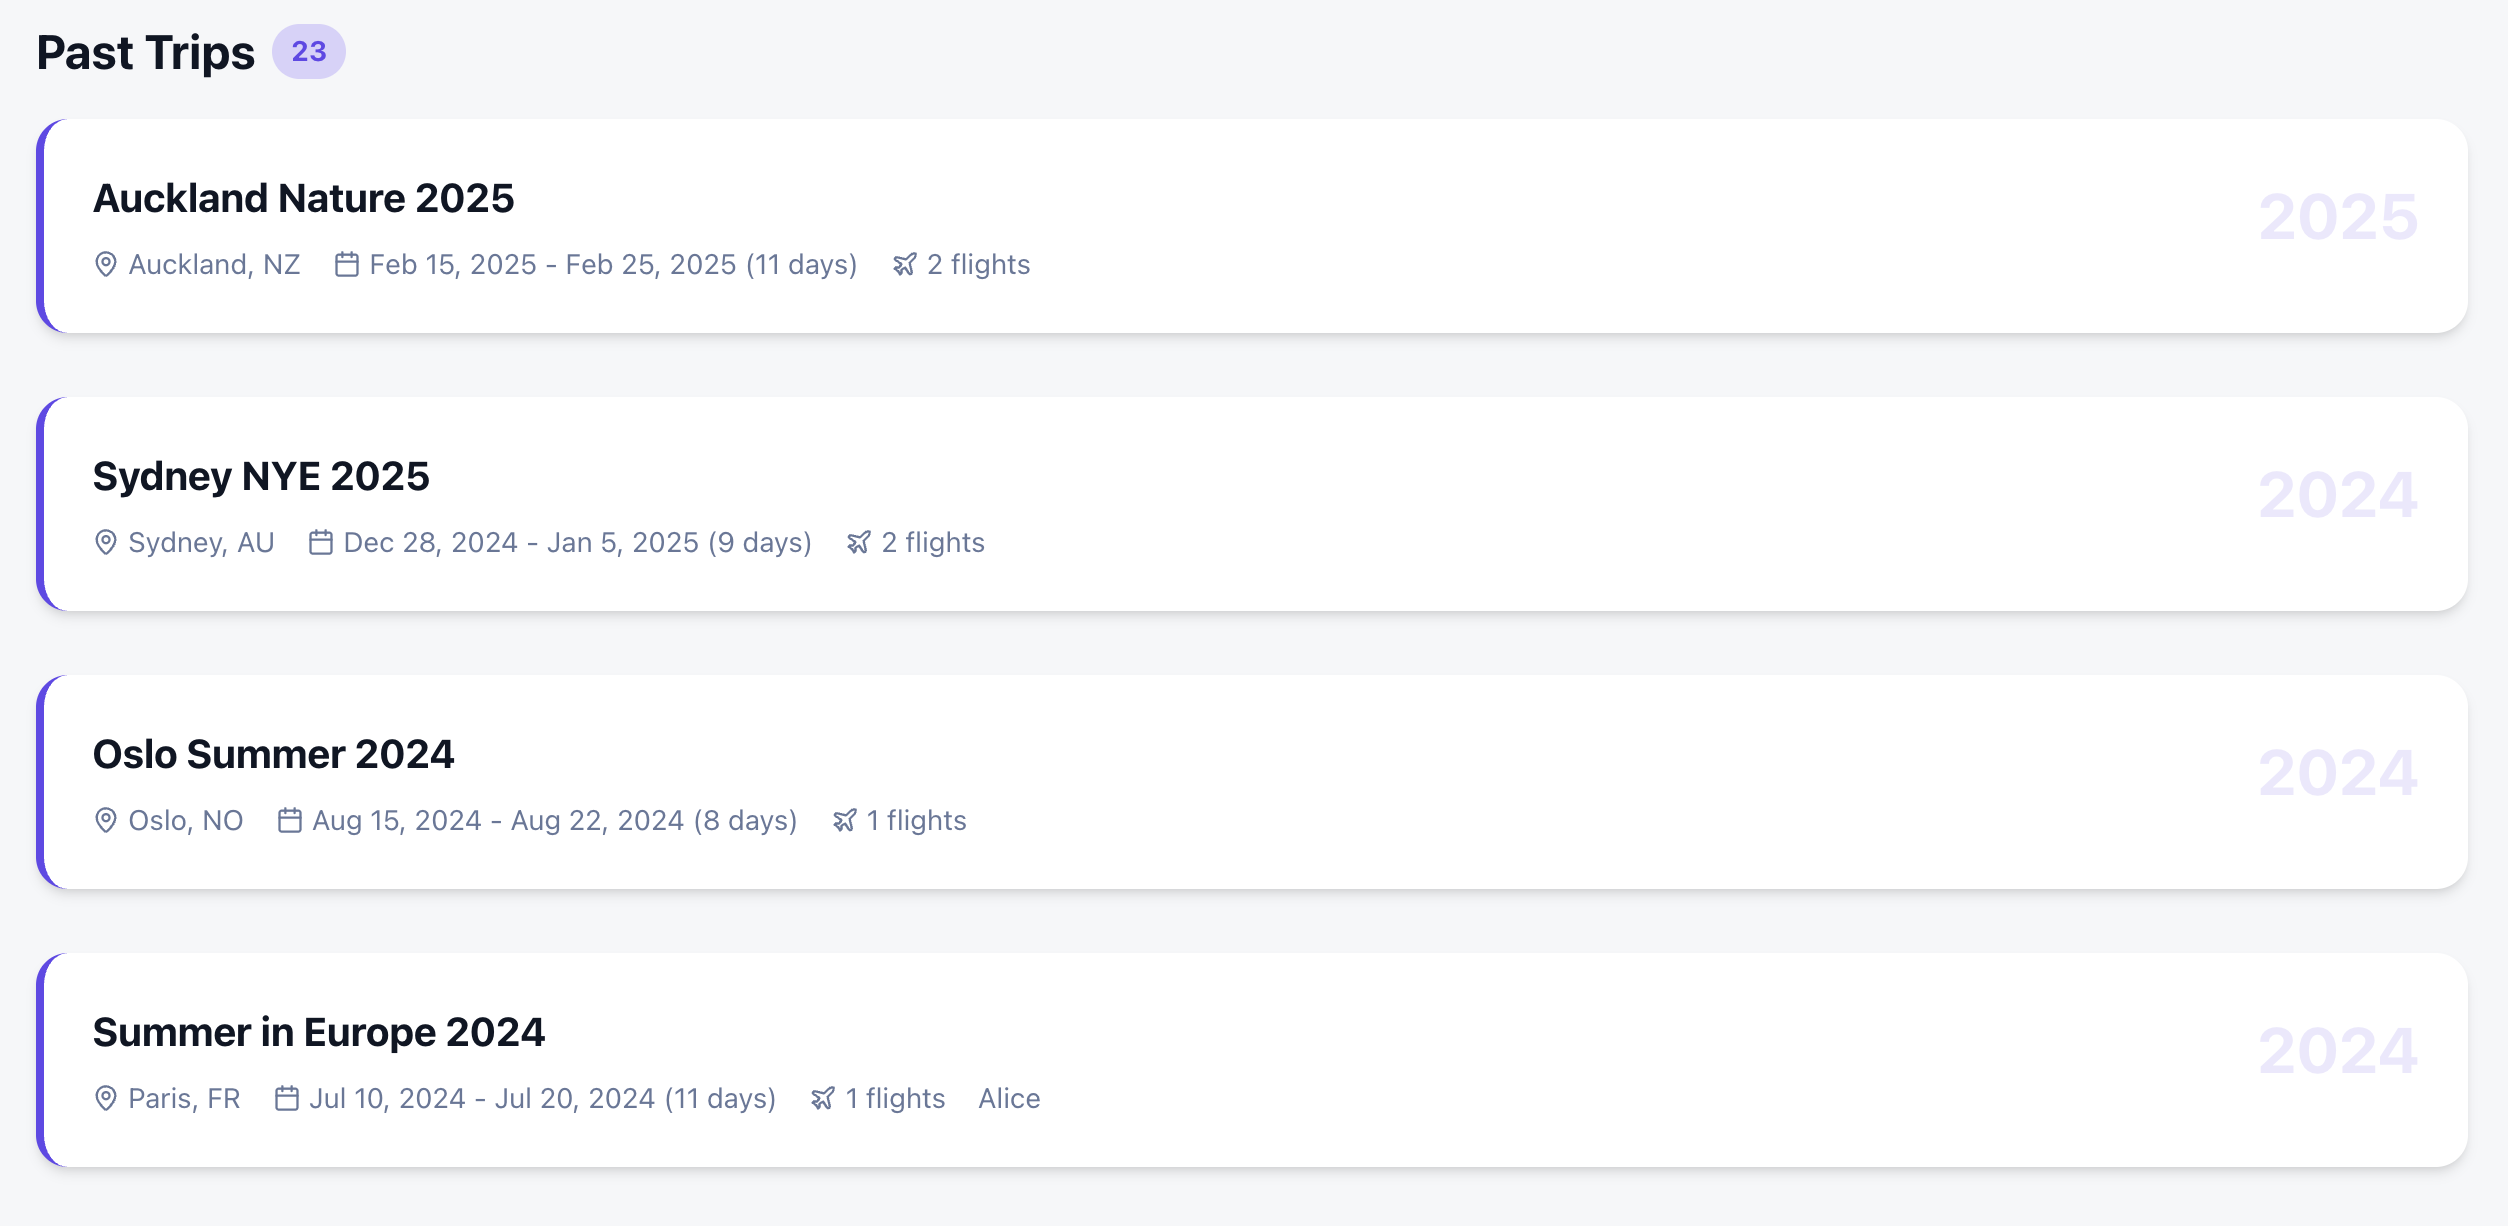
I wanted more than just a list of past trips. I wanted a comprehensive dashboard that felt like a mix of the best travel apps out there:
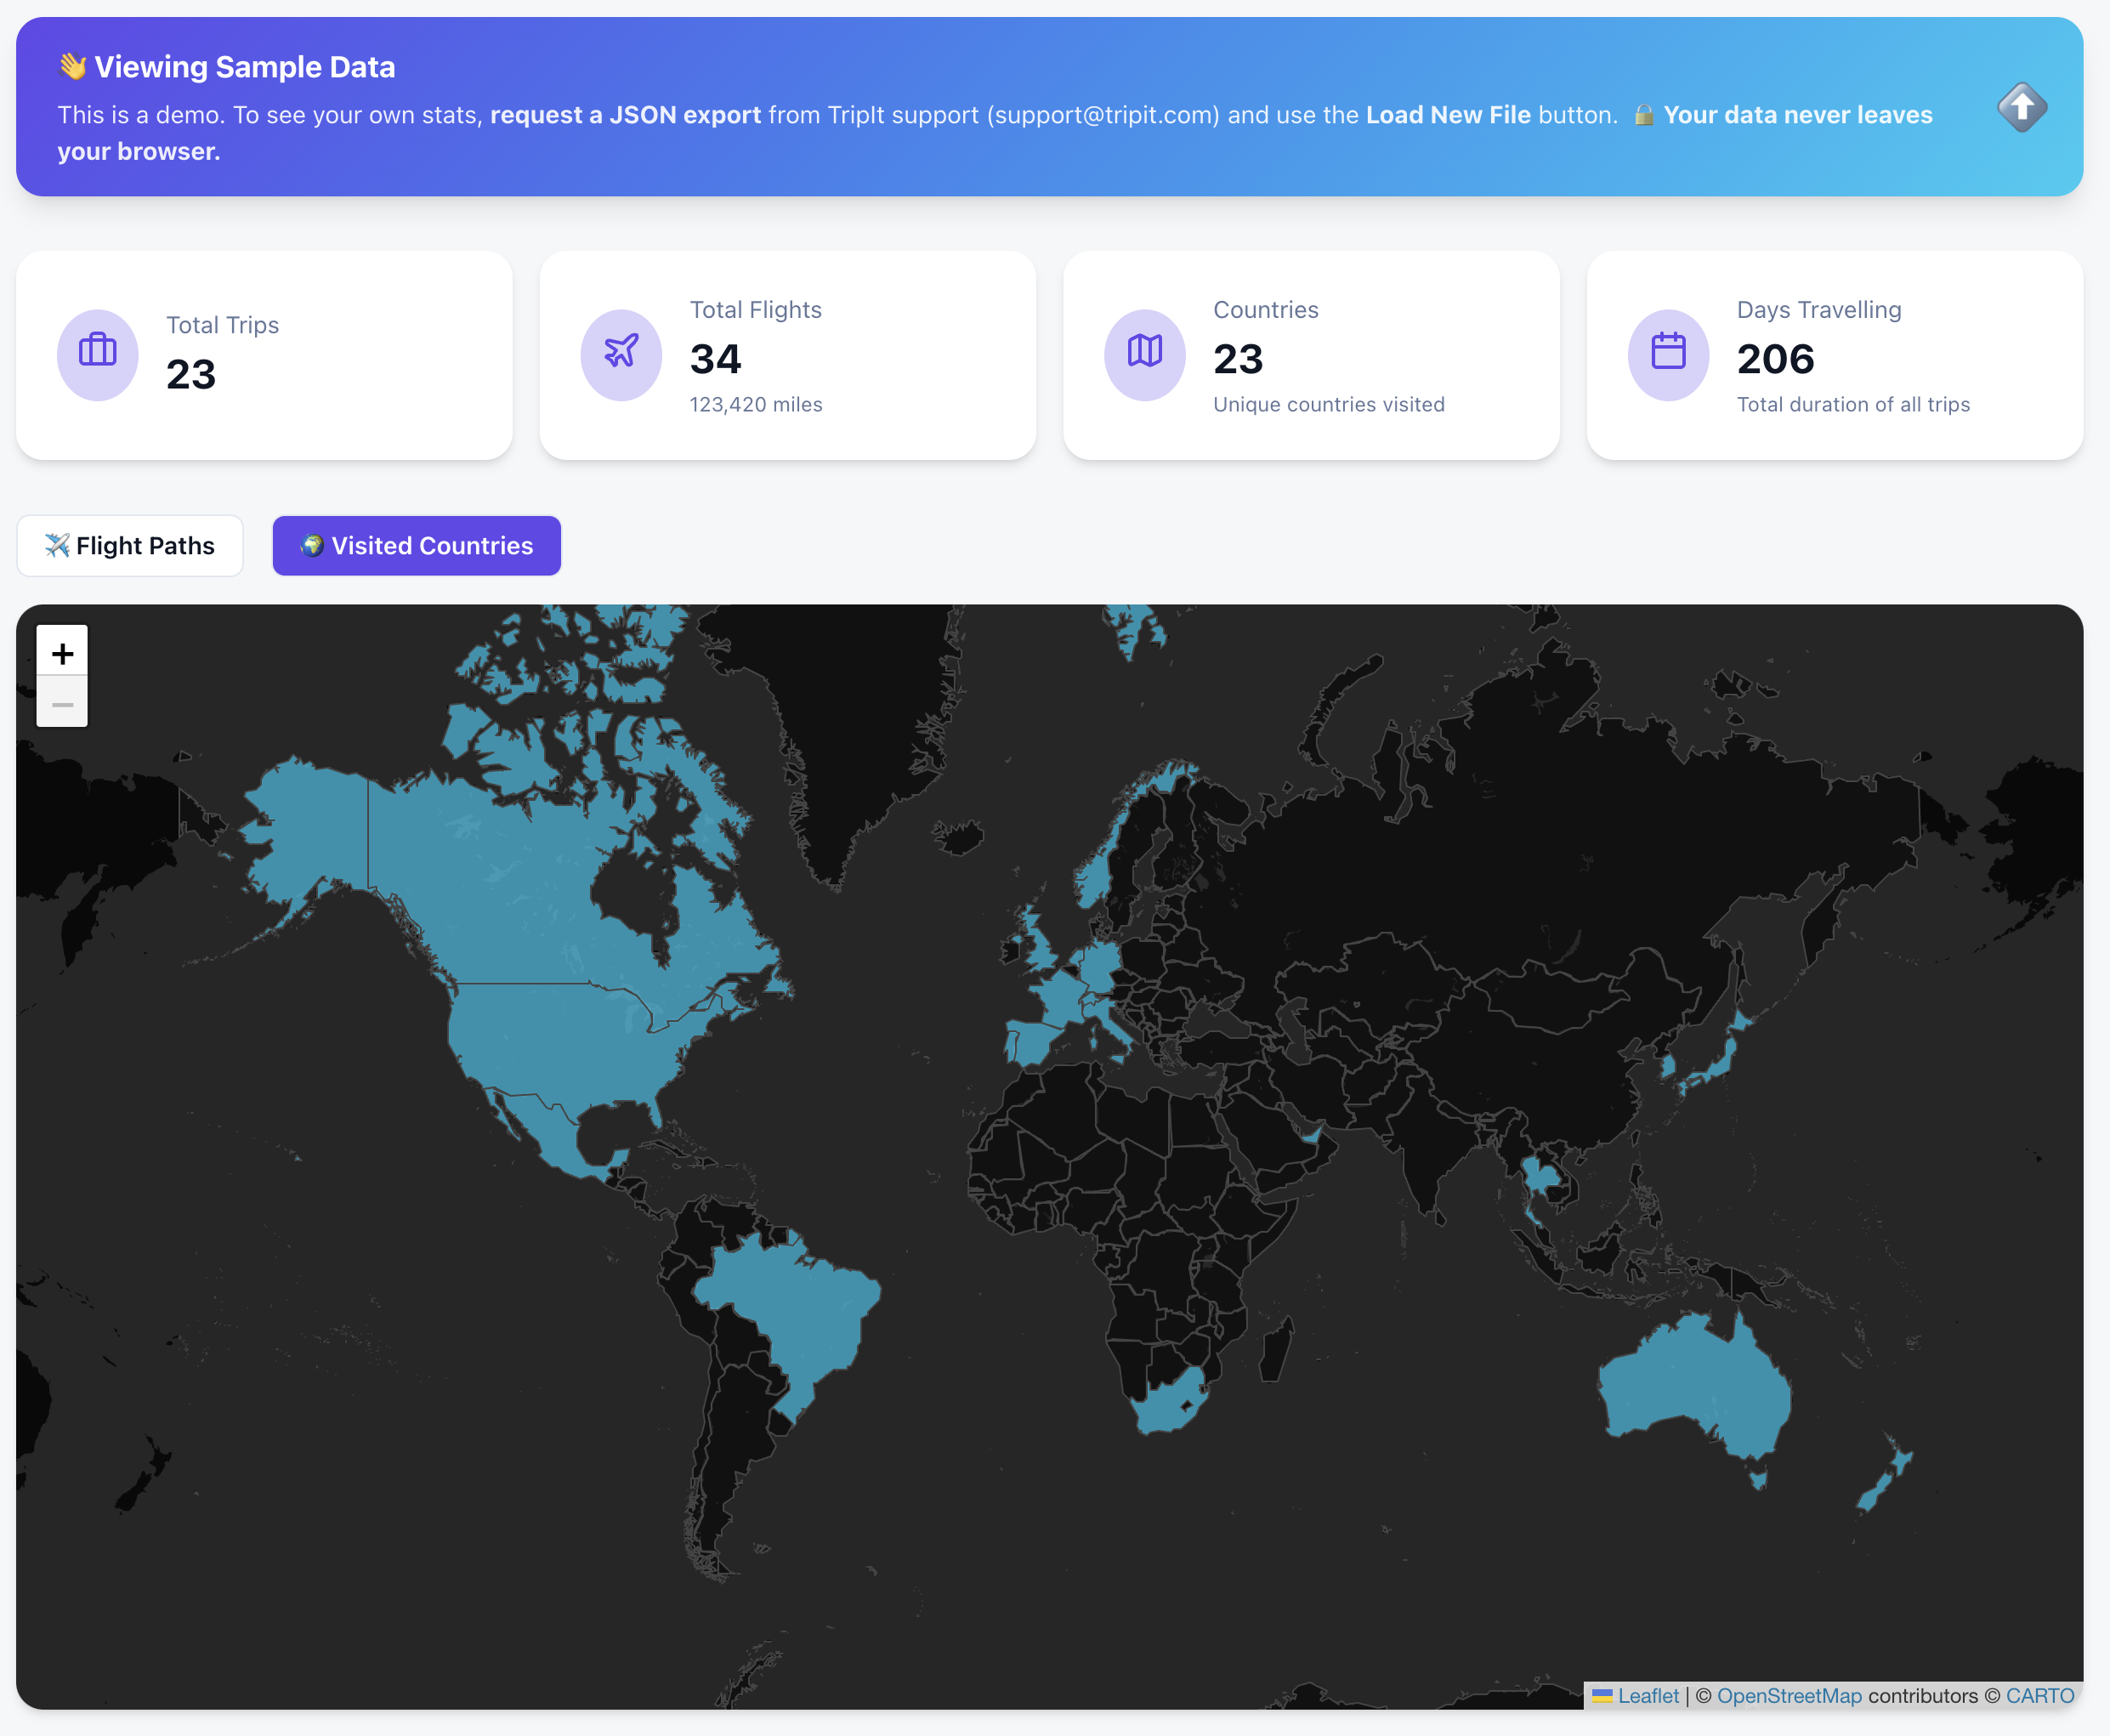
- Countries Visited: A high-level view of global coverage.
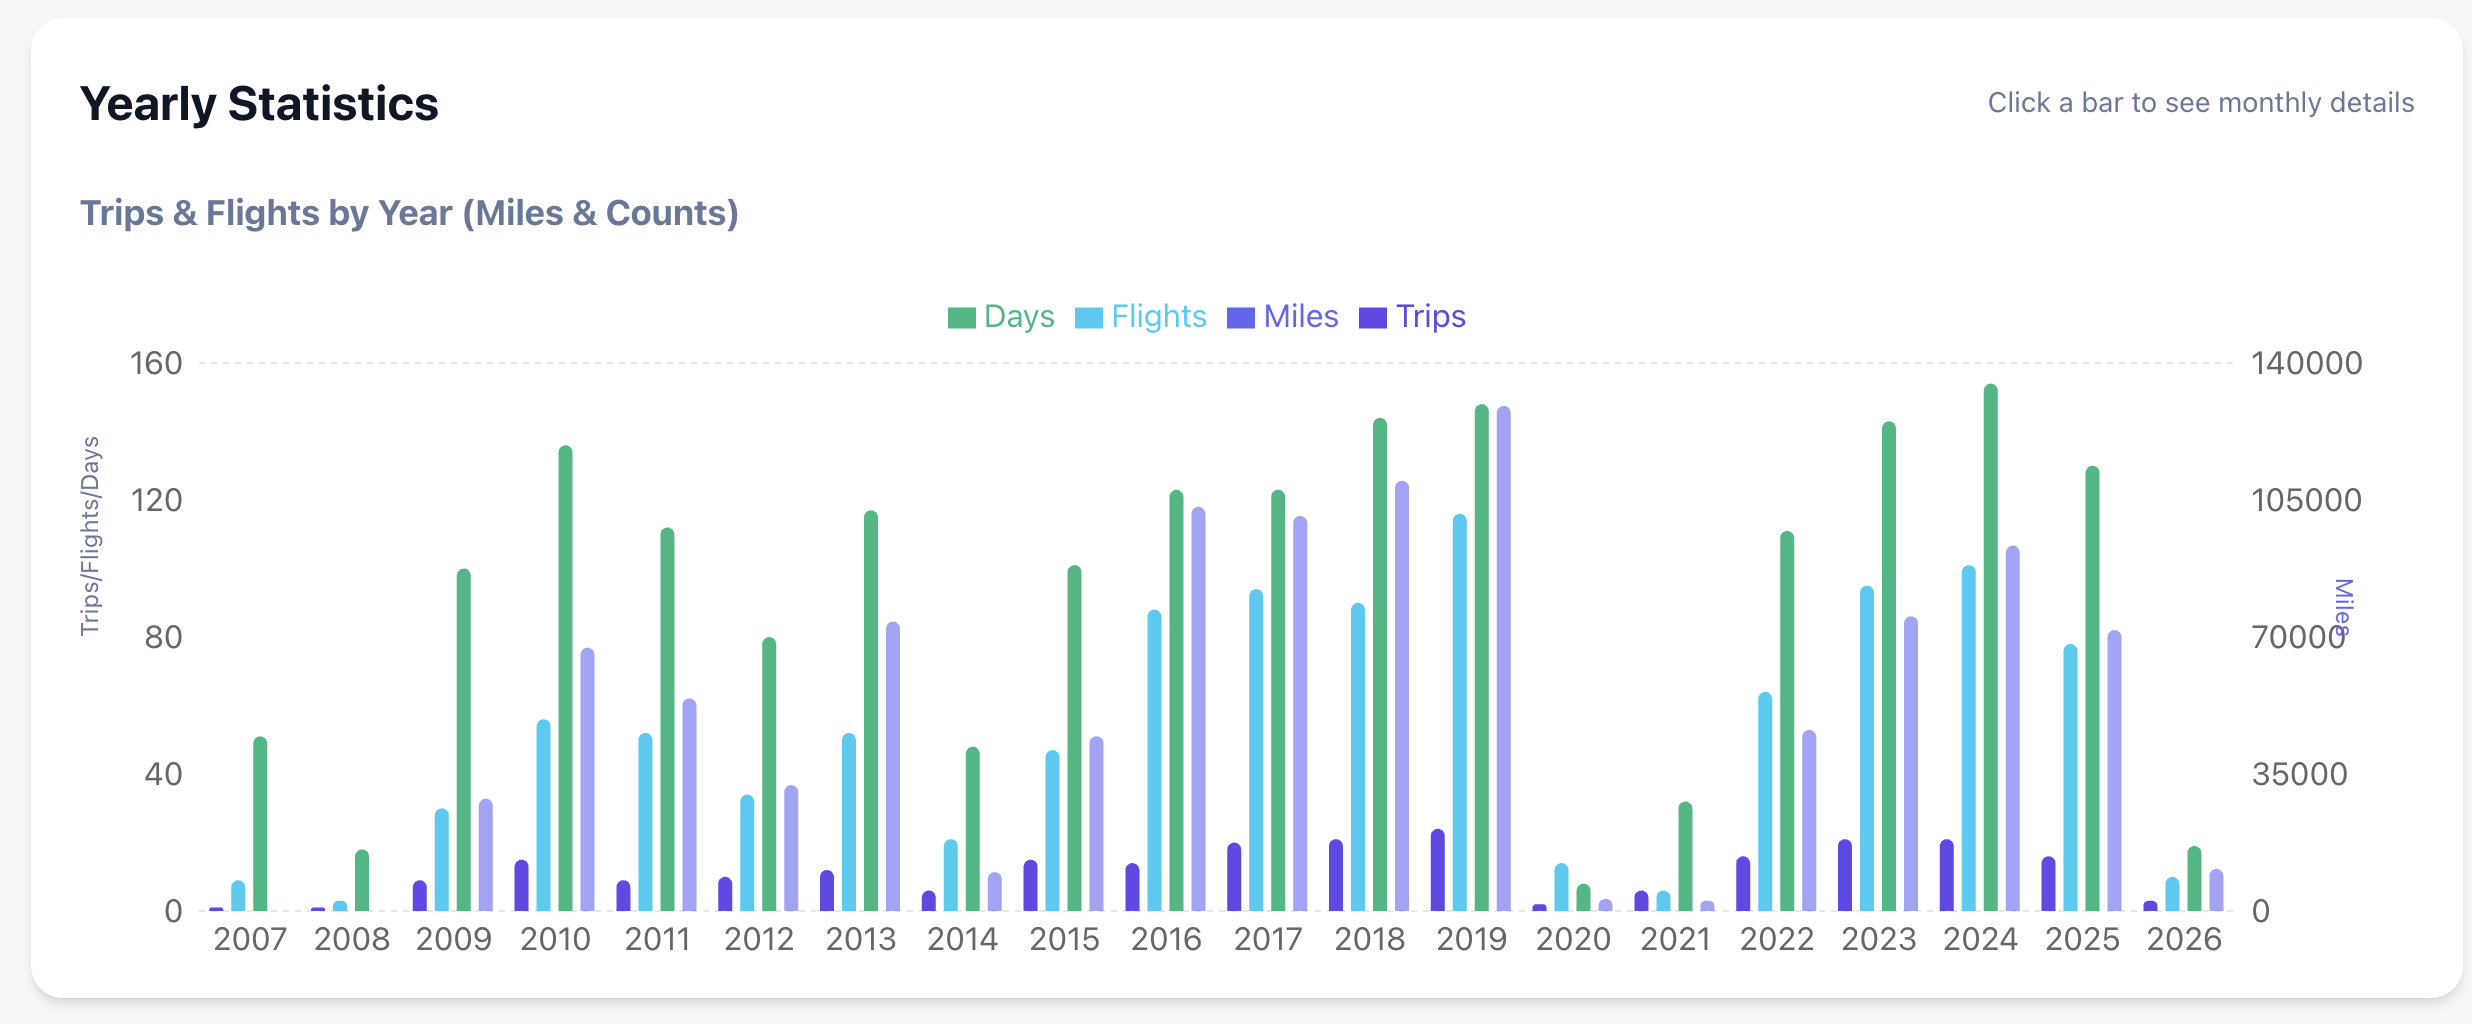
- Deep Statistics: Yearly and monthly breakdowns of flights, miles, and airline preferences.
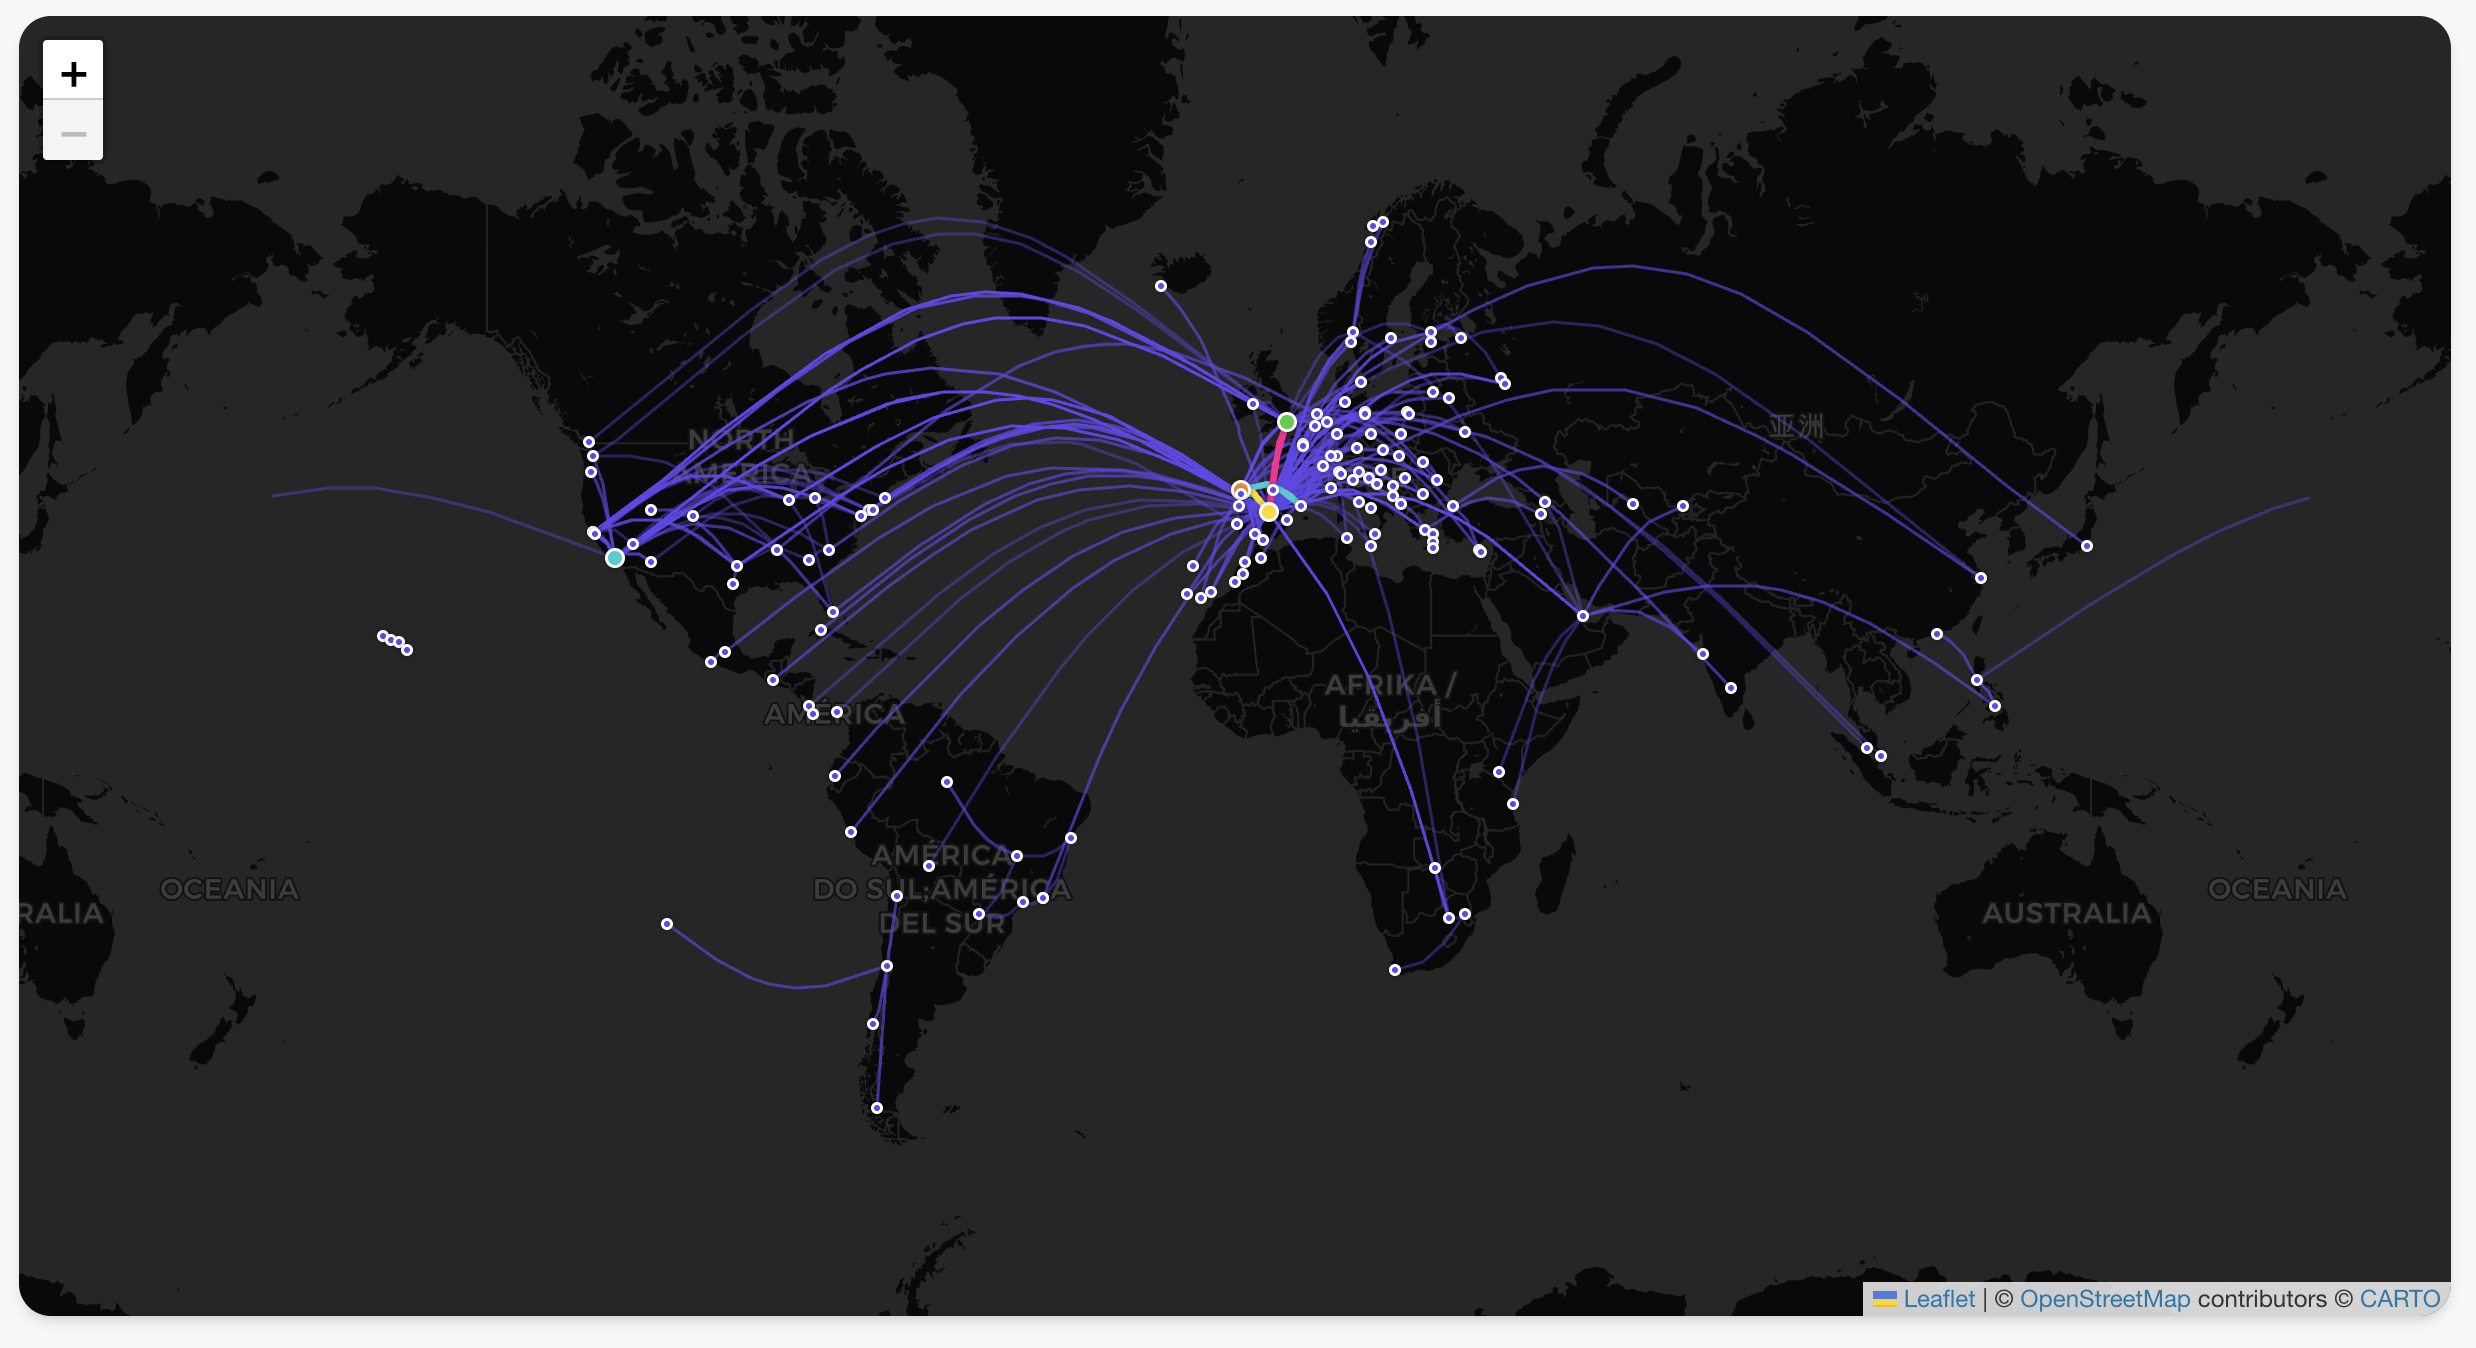
- Interactive Flight Paths: View every take-off and landing as a beautiful arc on a global map.
- Country Tracking: Automatically highlights every country you’ve visited based on your trip history.
- Deep-Dive Statistics: Automated breakdowns of your travels by year, month, and even specific airlines.
- Privacy-First Architecture: Your data never leaves your browser. There is no backend server storing your history; it’s all processed locally using your tripit export.
- Zero Friction: Don’t have your data yet? You can explore every feature using the Gemini generated Sample Data .
The Secret Sauce: Building with Google Antigravity & Gemini
The most remarkable part of this project wasn’t the code itself, but how fast it came together. The entire project took just a few hours, and complex visualizations were trivial to add. Which also hooks you into adding more and more features as it is too easy!
I used the Antigravity browser, which allowed for a feedback loop with Gemini. Instead of manually debugging CSS or layout issues, I could:
- Ask Gemini for a design change or a new feature.
- The AI would “see” the current state of the app via screenshots.
- It would provide the fix or the code block instantly based on the visual context.
This “visual-first” development meant I could spend more time on the logic of the data and less time wrestling with the UI.
Privacy First: Your Data Stays Yours
I wanted to ensure this tool was 100% private.
- Since there is no API, you need to request a JSON export from TripIt (thank you, GDPR!).
- Your data never leaves your browser. It’s processed locally, visualized, and saved for the next time you open the page.
📁 GitHub: carlossg/tripit-view
