
This is the third post in a Progressive Delivery series, see the previous ones:
Progressive Delivery is used by Netflix, Facebook and others to reduce the risk of deployments. But you can now adopt it when using Jenkins X.
Progressive Delivery is the next step after Continuous Delivery, where new versions are deployed to a subset of users and are evaluated in terms of correctness and performance before rolling them to the totality of the users and rolled back if not matching some key metrics.
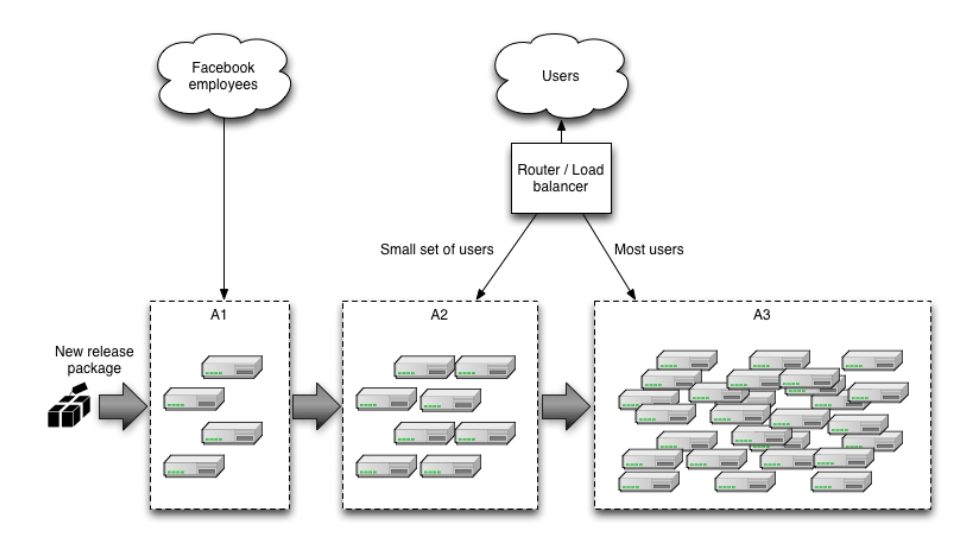
In particular we focused on Canary releases and made it really easy to adopt them in your Jenkins X applications. Canary releases consist on sending a small percentage of traffic to the new version of your application and validate there are no errors before rolling it out to the rest of the users. Facebook does it this way, delivering new versions first to internal employees, then a small percentage of the users, then everybody else, but you don’t need to be Facebook to take advantage of it!
You can read more on Canaries at Martin Fowler’s website.
Jenkins X
If you already have an application in Jenkins X you know that you can promote it to the “production” environment with jx promote myapp --version 1.0 --env production. But it can also be automatically and gradually rolled it out to a percentage of users while checking that the new version is not failing. If that happens the application will be automatically rolled back. No human intervention at all during the process.
NOTE: this new functionality is very recent and a number of these steps will not be needed in the future as they will also be automated by Jenkins X.
As the first step three Jenkins X addons need to be installed:
- Istio: a service mesh that allows us to manage traffic to our services.
- Prometheus: the most popular monitoring system in Kubernetes.
- Flagger: a project that uses Istio to automate canarying and rollbacks using metrics from Prometheus.
The addons can be installed (using a recent version of the jx cli) with
jx create addon istio
jx create addon prometheus
jx create addon flagger
This will enable Istio in the jx-production namespace for metrics gathering.
Now get the ip of the Istio ingress and point a wildcard domain to it (e.g. *.example.com), so we can use it to route multiple services based on host names. The Istio ingress provides the routing capabilities needed for Canary releases (traffic shifting) that the traditional Kubernetes ingress objects do not support.
kubectl -n istio-system get service istio-ingressgateway \
-o jsonpath='{.status.loadBalancer.ingress[0].ip}'
The cluster is configured, and it’s time to configure our application. Add a canary.yaml to your helm chart, under charts/myapp/templates.
{{- if eq .Release.Namespace "jx-production" }}
{{- if .Values.canary.enable }}
apiVersion: flagger.app/v1alpha2
kind: Canary
metadata:
  name: {{ template "fullname" . }}
spec:
  targetRef:
    apiVersion: apps/v1
    kind: Deployment
    name: {{ template "fullname" . }}
  progressDeadlineSeconds: 60
  service:
    port: {{.Values.service.internalPort}}
{{- if .Values.canary.service.gateways }}
    gateways:
{{ toYaml .Values.canary.service.gateways | indent 4 }}
{{- end }}
{{- if .Values.canary.service.hosts }}
    hosts:
{{ toYaml .Values.canary.service.hosts | indent 4 }}
{{- end }}
  canaryAnalysis:
    interval: {{ .Values.canary.canaryAnalysis.interval }}
    threshold: {{ .Values.canary.canaryAnalysis.threshold }}
    maxWeight: {{ .Values.canary.canaryAnalysis.maxWeight }}
    stepWeight: {{ .Values.canary.canaryAnalysis.stepWeight }}
{{- if .Values.canary.canaryAnalysis.metrics }}
    metrics:
{{ toYaml .Values.canary.canaryAnalysis.metrics | indent 4 }}
{{- end }}
{{- end }}
{{- end }}
Then append to the charts/myapp/values.yaml the following, changing myapp.example.com to your host name or names:
canary:
  enable: true
  service:
    # Istio virtual service host names
    hosts:
    - myapp.example.com
    gateways:
    - jx-gateway.istio-system.svc.cluster.local
  canaryAnalysis:
    # schedule interval (default 60s)
    interval: 60s
    # max number of failed metric checks before rollback
    threshold: 5
    # max traffic percentage routed to canary
    # percentage (0-100)
    maxWeight: 50
    # canary increment step
    # percentage (0-100)
    stepWeight: 10
    metrics:
    - name: istio_requests_total
      # minimum req success rate (non 5xx responses)
      # percentage (0-100)
      threshold: 99
      interval: 60s
    - name: istio_request_duration_seconds_bucket
      # maximum req duration P99
      # milliseconds
      threshold: 500
      interval: 60s
Soon, both the canary.yaml and values.yaml changes won’t be needed when you create your app from one of the Jenkins X quickstarts, as they will be Canary enabled by default.
That’s it! Now when the app is promoted to the production environment with jx promote myapp --version 1.0 --env production it will do a Canary rollout. Note that the first time it is promoted it will not do a Canary as it needs a previous version data to compare to, but it will work from the second promotion on.
With the configuration in the values.yaml file above it would look like:
- minute 1: send 10% of the traffic to the new version
- minute 2: send 20% of the traffic to the new version
- minute 3: send 30% of the traffic to the new version
- minute 4: send 40% of the traffic to the new version
- minute 5: send 100% of the traffic to the new version
If the metrics we have configured (request duration over 500 milliseconds or more than 1% responses returning 500 errors) fail, Flagger then will note that failure, and if it is repeated 5 times it will rollback the release, sending 100% of the traffic to the old version.
To get the Canary events run
$ kubectl -n jx-production get events --watch \
  --field-selector involvedObject.kind=Canary
LAST SEEN   FIRST SEEN   COUNT   NAME                                                  KIND     SUBOBJECT   TYPE     REASON   SOURCE    MESSAGE
23m         10d          7       jx-production-myapp.1584d8fbf5c306ee   Canary               Normal   Synced   flagger   New revision detected! Scaling up jx-production-myapp.jx-production
22m         10d          8       jx-production-myapp.1584d89a36d2e2f2   Canary               Normal   Synced   flagger   Starting canary analysis for jx-production-myapp.jx-production
22m         10d          8       jx-production-myapp.1584d89a38592636   Canary               Normal   Synced   flagger   Advance jx-production-myapp.jx-production canary weight 10
21m         10d          7       jx-production-myapp.1584d917ed63f6ec   Canary               Normal   Synced   flagger   Advance jx-production-myapp.jx-production canary weight 20
20m         10d          7       jx-production-myapp.1584d925d801faa0   Canary               Normal   Synced   flagger   Advance jx-production-myapp.jx-production canary weight 30
19m         10d          7       jx-production-myapp.1584d933da5f218e   Canary               Normal   Synced   flagger   Advance jx-production-myapp.jx-production canary weight 40
18m         10d          6       jx-production-myapp.1584d941d4cb21e8   Canary               Normal   Synced   flagger   Advance jx-production-myapp.jx-production canary weight 50
18m         10d          6       jx-production-myapp.1584d941d4cbc55b   Canary               Normal   Synced   flagger   Copying jx-production-myapp.jx-production template spec to jx-production-myapp-primary.jx-production
17m         10d          6       jx-production-myapp.1584d94fd1218ebc   Canary               Normal   Synced   flagger   Promotion completed! Scaling down jx-production-myapp.jx-production
Dashboard
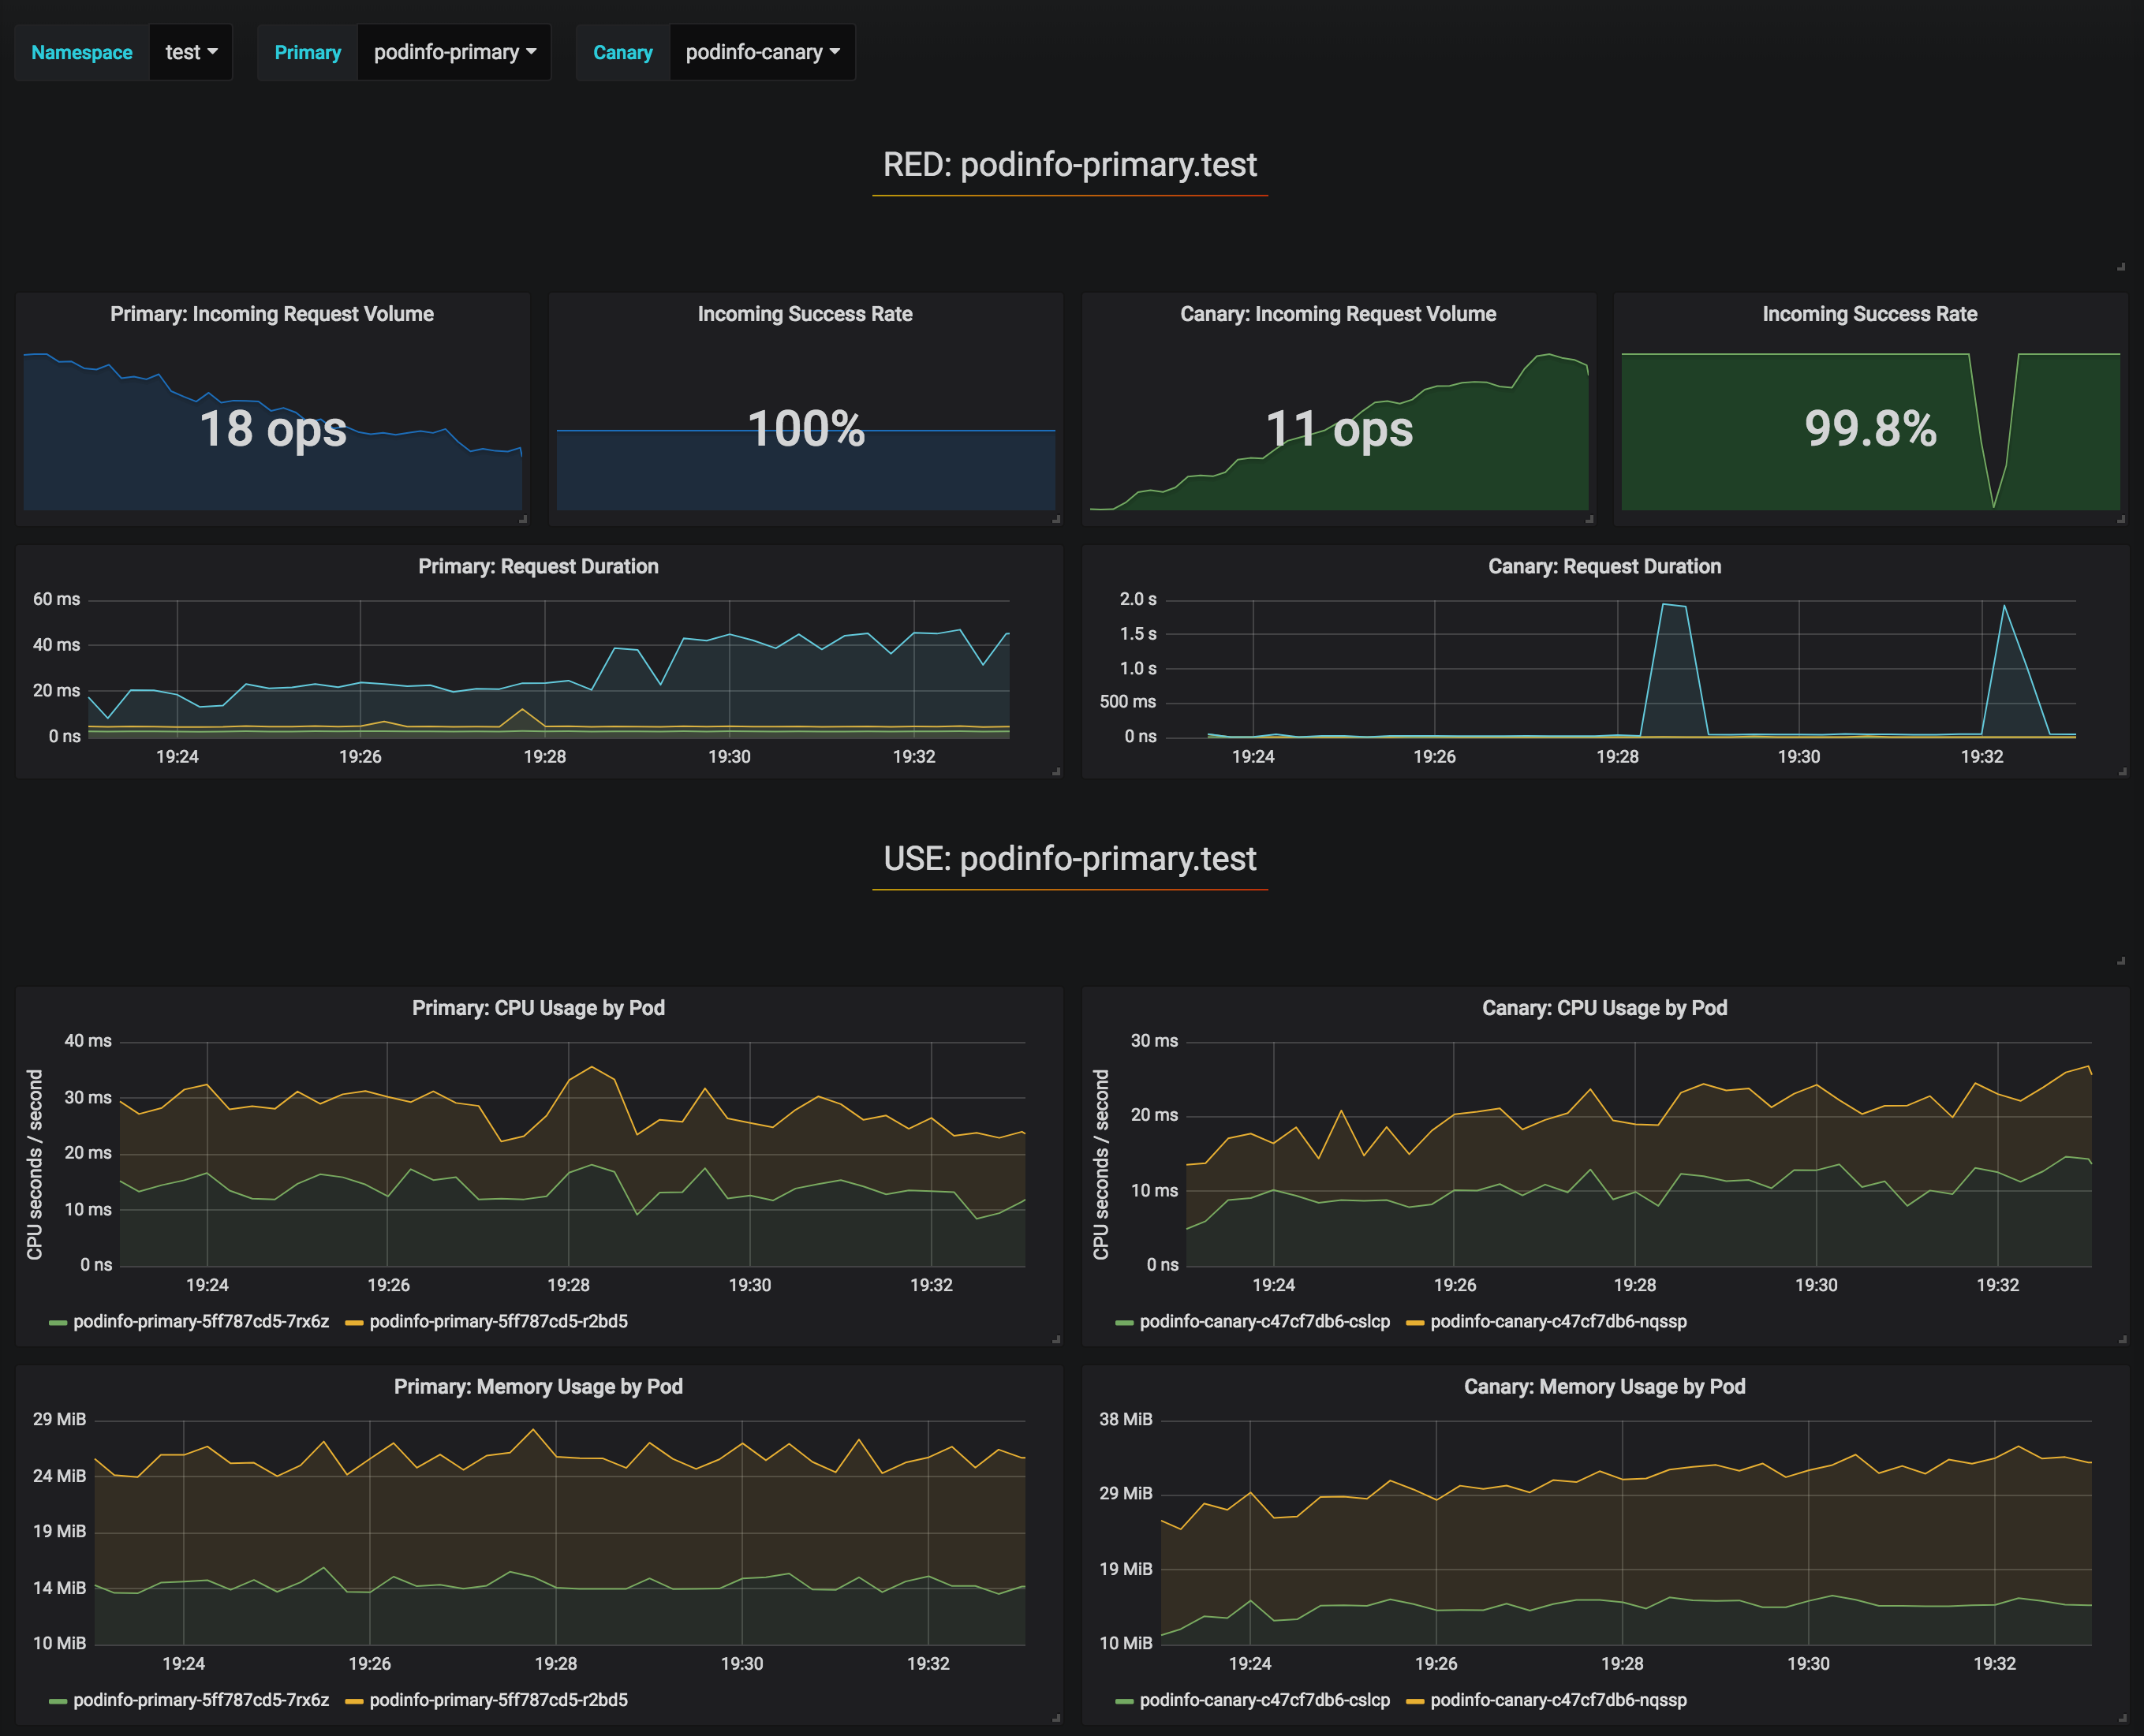
Flagger includes a Grafana dashboard for visualization purposes as it is not needed for the Canary releases. It can be accessed locally using Kubernetes port forwarding
kubectl --namespace istio-system port-forward deploy/flagger-grafana 3000
Then accessing http://localhost:3000 using admin/admin, selecting the canary-analysis dashboard and
- namespace:
jx-production
- primary:
jx-production-myapp-primary
- canary:
jx-production-myapp
would provide us with a view of different metrics (cpu, memory, request duration, response errors,…) of the incumbent and new versions side by side.
Caveats
Note that Istio by default will prevent access from your pods to the outside of the cluster (a behavior that is expected to change in Istio 1.1). Learn how to control the Istio egress traffic.
If a rollback happens automatically because the metrics fail, the Jenkins X GitOps repository for the production environment becomes out of date, still using the new version instead of the old one. This is something planned to be fixed in next releases.

 Jenkins 中国巡演. 你好. The next two weeks I’ll be in China participating in the Continuous Delivery Summit, KubeCon and several Jenkins related events, and giving some talks:
 While testing
  The
The  The
The