Most canary analysis is a threshold check: error rate > X%, latency > Yms, done. I wanted to see what happens if you replace that with something closer to how a human on-call engineer actually decides — read the logs, check the metrics, look at the events, and weigh them against each other.
So I built an AI-powered metric plugin for Argo Rollouts that can call an agent over A2A: a Lead Orchestrator agent that fans out to three specialists — a Log Analyst, a Metrics Analyst, and an Events Analyst — each independently investigating the canary vs. the stable version. They report back, debate, and the orchestrator resolves any disagreement into a single promote/abort verdict, running on Gemini via Google’s Antigravity agent framework, with some agents sandboxed on GKE Autopilot’s Agent Sandbox (gVisor) for isolation.
The most interesting part wasn’t the happy path — it was the debugging. A broken release gets caught in under a minute: two agents vote to promote based on clean resource metrics, but the Log Analyst — the one that actually read the logs — vetoes it, and the orchestrator sides with the evidence.
Multi-agent systems earn their keep when they’re allowed to disagree with each other, not just when they’re all pointed at the same task in parallel.
There are several flavours of “give a workload its own isolated runtime on Kubernetes” floating around right now. We wanted a head-to-head comparison — not a slide-deck comparison, but one with real numbers against a non-trivial workload that exercises identity routing, port forwarding, WebSocket upgrades, and a heavy long-lived process. Playwright driving Chromium is exactly that workload. This post walks through how we tested four sandboxing technologies — agent-sandbox, OpenShell, substrate, and KarsSandbox — against the same Playwright harness, what we found, and what each option is actually good at.
Most sandboxing demos use traefik/whoami or nginx. Both are useful for a smoke test and useless for telling sandboxing options apart, because they don’t stress anything. Real agent workloads do. Playwright gives us, in one process tree:
A long-lived stateful process (Chromium with ~6 child processes, hundreds of MB of memory).
A native WebSocket protocol (chromium.connect(wsEndpoint)), which requires HTTP upgrade handling end-to-end through the data plane.
A non-trivial cold-start cost that’s measurable and stable (Node + Chromium boot is ~3 seconds).
A real possibility of checkpoint/restore value — Chromium with a warm page tree is genuinely expensive to recreate, so the snapshot story is interesting to test rather than theoretical.
A clear correctness oracle — page.goto(url) either fetches the page or it doesn’t.
So each “test” in our harness is: instantiate a sandbox per tenant, get a Playwright client to connect over WebSocket, open a page, fetch a URL, measure each phase.
Stateless. CR deletion destroys both namespace and pod.
The first two are mechanically identical — same CRDs, same controller — and both can run with runc, gVisor (runsc), or Kata Containers by pointing the SandboxTemplate at the appropriate RuntimeClass. We ran them with the cluster default (runc) for the bench.
KarsSandbox takes a different approach: each sandbox gets its own dedicated namespace (not just a pod), providing stronger isolation boundaries and compatibility with Azure-specific runtime features like InferencePolicy for AI/GPU workloads. Unlike agent-sandbox’s warmpool model, KARS provisions sandboxes on-demand.
The interesting comparison isn’t really “container vs gVisor” — multiple models can do gVisor — it’s warmpool of pre-bound pods vs on-demand namespace provisioning vs substrate’s actor lifecycle with snapshot/restore.
The test harness
To make the comparison a bit similar we built a small proxy that abstracts the four backends behind one interface. Each backend implements Ensure(id) → Endpoint + Delete(id); the proxy handles caller identification, session caching, idle reaping, and WebSocket upgrade forwarding identically across all four. That way, when we compare bench numbers, we’re comparing the sandboxing technology, not four different ad-hoc client implementations.
┌─ test client pod ┐ ┌─ proxy ─────────┐ ┌─ backend ─────────┐
└──────────────────┘ │ reverse proxy │ │ - Actor (gRPC) │
│ idle reaper │ │ - KarsSandbox CR │
└────────┬────────┘ └─────────┬─────────┘
│ │
│ ┌─────────▼─────────┐
└──HTTP / WS upgrade─────▶│ Chromium sandbox │
└───────────────────┘
The proxy identifies callers by pod label: the test client sets metadata.labels.playwright-id on its Deployment, the proxy looks up the caller’s pod IP via a client-go informer and resolves it to that id. No agent-side SDK, no token plumbing — just one label. Each unique id gets its own sandbox.
Three scenarios per backend:
Scenario
Setup
Measures
cold
Delete any prior sandbox, then connect for the first time.
Connect again with the same id, sandbox still alive.
Steady-state cost: proxy hop + WS upgrade only.
restore
Out-of-band suspend (substrate) or wipe (sandboxclaim), then a fresh request.
The persistence story: does the sandbox come back faster than a cold start?
What the agent-sandbox / OpenShell flow looks like
Both back ends share the same CRD lifecycle: the proxy creates a SandboxClaim, the agent-sandbox controller picks a warm pod from the pool, binds it to the claim, and the proxy gets back an endpoint.
There is no checkpoint/restore in this model. A claim’s life is the sandbox’s life; deleting the claim destroys the pod, and the next call for the same id gets a fresh warm pod from the pool. The “restore” scenario therefore re-creates the claim and behaves identically to cold. The interesting question this design answers well is: how cheap can a cold-start be when you have warm capacity pre-allocated? Answer below.
OpenShell’s flow is the same shape; the only difference is the added process isolation and OpenShell features.
What substrate’s flow looks like
Substrate is a different beast. Each tenant gets an “Actor” living inside a gVisor sandbox on a worker pod. The data plane is atenet-router (Envoy with an ext_proc filter) which dispatches to the right worker pod by Host: <actor-id>.actors.resources.substrate.ate.dev. Actor lifecycle (Create, Resume, Suspend, Delete) is a gRPC API on ate-api-server.
In principle, substrate gives you persistent sandboxes — suspend an actor mid-session, restore it later, and Chromium picks up where it left off with all its in-memory state intact. That’s the headline feature you don’t get from container-with-warmpool or namespace-scoped sandboxes. Whether it actually works is the interesting test result.
What KarsSandbox’s flow looks like
KarsSandbox uses Azure’s KARS (Kubernetes Azure Runtime Sandboxes) controller to provision a dedicated namespace per tenant. Each KarsSandbox CR (kars.azure.com/v1alpha1, runtime: BYO) triggers the controller to create both a namespace and the sandbox pod within it. The proxy polls status.phase=Running then locates the pod IP via the CoreV1 API.
Unlike agent-sandbox’s warmpool or substrate’s actor pool, KARS provisions resources on-demand. The tradeoff is no pre-warmed capacity, but you get namespace-level isolation that plays well with Azure-specific features like InferencePolicy for GPU scheduling.
State across runs: None, like agent-sandbox. A KarsSandbox CR creates a dedicated namespace and pod; when the CR is deleted (idle reap or explicit Delete), both the namespace and pod are destroyed by the KARS controller. The next caller for the same id gets a brand-new isolated sandbox. Reuse only happens while the sandbox is alive.
RBAC requirements: The proxy needs additional permissions beyond the base ClusterRole:
- apiGroups: ["kars.azure.com"]
  resources: ["karssandboxes"]
  verbs: ["get", "list", "watch", "create", "delete"]
- apiGroups: ["kars.azure.com"]
  resources: ["karssandboxes/status"]
  verbs: ["get"]
- apiGroups: [""]
  resources: ["pods"]
  verbs: ["get", "list"]  # To locate pod IP after KarsSandbox is Running
See deploy/examples/kars/ for complete deployment manifests including proxy configuration, RBAC patches, and InferencePolicy examples.
The numbers
Run on Colima 16 GiB / 6 CPU, kind 1.33, arm64. All scenarios pass (KARS results pending).
Container-with-warmpool wins on cold-start by ~6×. agent-sandbox and OpenShell come in ~580–600ms cold; substrate is 3.6s. The warmpool model amortizes container start-up at provisioning time; substrate has pre-warmed worker pods, but the user workload (Node + Chromium) still boots cold inside the gVisor sandbox on every cold-start.
All three are essentially free at warm. 60–100ms total at warm — the proxy hop and WS handshake dominate. The choice of backend doesn’t matter once the sandbox is up.
Substrate’s “restore” is fast (198ms) for the wrong reason. The bench’s suspend leaves the worker pod hot — the OCI bundle is already extracted on disk — so the boot-from-spec restore reuses cached state. With working snapshot restore, this would be the most interesting cell in the table; today, it doesn’t prove much.
The 3.6s substrate cold-start isn’t just gVisor. A meaningful chunk of it is Node + Chromium boot itself, plus the actor lifecycle workflow (CreateActor → AssignWorker → AteletRestore → URPC into the sentry). Running agent-sandbox under gVisor via RuntimeClass would add some runsc-specific overhead to its ~580ms cold, but not the full 3s gap — the rest is substrate’s per-tenant actor setup vs agent-sandbox’s “the warm pod already exists, just bind it” model.
When to use which
Based on what testing actually surfaced:
agent-sandbox is the safe default for browser-style workloads. Sub-second cold-start, trivial to operate (one CRD, one controller, one warmpool per template), and the model is easy to reason about — claim’s life is the pod’s life. If you need gVisor or Kata isolation, swap the RuntimeClass on the SandboxTemplate; you keep the same controller and the same warmpool semantics. The OpenShell flavor demonstrates how easy it is to fork the image story without touching the controller.
OpenShell adds little value with agent-sandbox gVisor isolation. Adds process isolation when using default RuntimeClass.
substrate is the right answer when you need per-tenant snapshot/ restore — suspend an actor mid-session, ship the checkpoint elsewhere, restore later with browser state intact. That’s the capability nothing else in this comparison offers. gVisor isolation alone is not the differentiator (agent-sandbox can do that too via RuntimeClass); the actor lifecycle + S3-backed snapshots is. Today the snapshot path needs work in our environment, so we’re paying substrate’s per-tenant boot cost without yet getting the persistence benefit; once snapshot restore is reliable end-to-end, the substrate story becomes very compelling.
KarsSandbox is the choice for Azure/AKS environments where you need stronger isolation boundaries than pod-level (each tenant gets its own namespace) or integration with Azure-specific features like InferencePolicy for AI/GPU workloads. The on-demand provisioning model means no warmpool capacity planning, but cold-starts will be slower than agent-sandbox since KARS must create both namespace and pod from scratch. Best fit for multi-tenant scenarios on AKS where namespace-level RBAC and resource quotas matter, or when targeting Azure’s runtime sandbox extensions.
Try it yourself
git clone https://github.com/carlossg/playwright-k8s-sandbox
cd playwright-k8s-sandbox
./test/harness.sh up         # spin up the agent-sandbox kind cluster
./test/harness.sh up-kars    # spin up the KARS kind cluster
./test/bench.sh all          # run cold/warm/restore against all backends
./test/bench.sh kars         # run KARS-specific benchmarks
For substrate you’ll also need its own kind cluster and the ate.dev control plane installed (hack/install-ate-kind.sh in the substrate repo). The full architecture deep-dive — including the sequence diagrams, identity model, idle-reap policy, and the bench methodology — is at docs/ARCHITECTURE.md.
KARS test harness commands:
./test/harness.sh up-kars      # Create KARS cluster with controller
./test/harness.sh test kars    # Run integration tests
./test/bench.sh kars           # Run cold/warm/restore benchmarks
./test/harness.sh down-kars    # Cleanup
If you’re picking a Kubernetes sandboxing technology for a new workload, the meta-takeaway is: build a small harness around your actual workload (whatever it is), put it through cold/warm/restore on the candidates, and let the numbers + the debugging stories decide. The harness in this repo is built around Playwright; the same shape works for anything with a WebSocket or HTTP frontend.
To deploy to Amazon Elastic Container Registry (ECR) we can create a secret with AWS credentials or we can run with more secure IAM node instance roles.
When running on EKS we would have an EKS worker node IAM role (NodeInstanceRole), we need to add the IAM permissions to be able to pull and push from ECR. These permissions are grouped in the arn:aws:iam::aws:policy/AmazonEC2ContainerRegistryPowerUser policy, that can be attached to the node instance role.
When using instance roles we no longer need a secret, but we still need to configure kaniko to authenticate to AWS, by using a config.json containing just { "credsStore": "ecr-login" }, mounted in /kaniko/.docker/.
We also need to create the ECR repository beforehand, and, if using caching, another one for the cache.
ACCOUNT=$(aws sts get-caller-identity --query Account --output text)
REPOSITORY=kanikorepo
REGION=us-east-1
# create the repository to push to
aws ecr create-repository --repository-name ${REPOSITORY}/kaniko-demo --region ${REGION}
# when using cache we need another repository for it
aws ecr create-repository --repository-name ${REPOSITORY}/kaniko-demo/cache --region ${REGION}

cat << EOF | kubectl create -f -
apiVersion: v1
kind: Pod
metadata:
  name: kaniko-eks
spec:
  restartPolicy: Never
  containers:
  - name: kaniko
    image: gcr.io/kaniko-project/executor:v1.0.0
    imagePullPolicy: Always
    args: ["--dockerfile=Dockerfile",
            "--context=git://github.com/carlossg/kaniko-demo.git",
            "--destination=${ACCOUNT}.dkr.ecr.${REGION}.amazonaws.com/${REPOSITORY}/kaniko-demo:latest",
            "--cache=true"]
    volumeMounts:
      - name: docker-config
        mountPath: /kaniko/.docker/
    resources:
      limits:
        cpu: 1
        memory: 1Gi
  volumes:
    - name: docker-config
      configMap:
        name: docker-config
---
apiVersion: v1
kind: ConfigMap
metadata:
  name: docker-config
data:
  config.json: |-
    { "credsStore": "ecr-login" }
EOF
To push to Azure Container Registry (ACR) we can create an admin password for the ACR registry and use the standard Docker registry method or we can use a token. We use that token to craft both the standard Docker config file at /kaniko/.docker/config.json plus the ACR specific file used by the Docker ACR credential helper in /kaniko/.docker/acr/config.json. ACR does support caching and so it will push the intermediate layers to ${REGISTRY_NAME}.azurecr.io/kaniko-demo/cache:_some_large_uuid_ to be reused in subsequent builds.
RESOURCE_GROUP=kaniko-demo
REGISTRY_NAME=kaniko-demo
LOCATION=eastus
az login
# Create the resource group
az group create --name $RESOURCE_GROUP -l $LOCATION
# Create the ACR registry
az acr create --resource-group $RESOURCE_GROUP --name $REGISTRY_NAME --sku Basic
# If we want to enable password based authentication
# az acr update -n $REGISTRY_NAME --admin-enabled true

# Get the token
token=$(az acr login --name $REGISTRY_NAME --expose-token | jq -r '.accessToken')
To push to Google Container Registry (GCR) we need to login to Google Cloud and mount our local $HOME/.config/gcloud containing our credentials into the kaniko container so it can push to GCR. GCR does support caching and so it will push the intermediate layers to gcr.io/$PROJECT/kaniko-demo/cache:_some_large_uuid_ to be reused in subsequent builds.
git clone https://github.com/carlossg/kaniko-demo.git
cd kaniko-demo

gcloud auth application-default login # get the Google Cloud credentials
PROJECT=$(gcloud config get-value project 2> /dev/null) # Your Google Cloud project id
docker run \
    -v $HOME/.config/gcloud:/root/.config/gcloud:ro \
    -v `pwd`:/workspace \
    gcr.io/kaniko-project/executor:v1.0.0 \
    --destination gcr.io/$PROJECT/kaniko-demo:kaniko-docker \
    --cache
kaniko can cache layers created by RUN commands in a remote repository. Before executing a command, kaniko checks the cache for the layer. If it exists, kaniko will pull and extract the cached layer instead of executing the command. If not, kaniko will execute the command and then push the newly created layer to the cache.
We can see in the output how kaniko uploads the intermediate layers to the cache.
INFO[0001] Resolved base name golang to build-env
INFO[0001] Retrieving image manifest golang
INFO[0001] Retrieving image golang
INFO[0004] Retrieving image manifest golang
INFO[0004] Retrieving image golang
INFO[0006] No base image, nothing to extract
INFO[0006] Built cross stage deps: map[0:[/src/bin/kaniko-demo]]
INFO[0006] Retrieving image manifest golang
INFO[0006] Retrieving image golang
INFO[0008] Retrieving image manifest golang
INFO[0008] Retrieving image golang
INFO[0010] Executing 0 build triggers
INFO[0010] Using files from context: [/workspace]
INFO[0011] Checking for cached layer gcr.io/api-project-642841493686/kaniko-demo/cache:0ab16b2e8a90e3820282b9f1ef6faf5b9a083e1fbfe8a445c36abcca00236b4f...
INFO[0011] No cached layer found for cmd RUN cd /src && make
INFO[0011] Unpacking rootfs as cmd ADD . /src requires it.
INFO[0051] Using files from context: [/workspace]
INFO[0051] ADD . /src
INFO[0051] Taking snapshot of files...
INFO[0051] RUN cd /src && make
INFO[0051] Taking snapshot of full filesystem...
INFO[0061] cmd: /bin/sh
INFO[0061] args: [-c cd /src && make]
INFO[0061] Running: [/bin/sh -c cd /src && make]
CGO_ENABLED=0 go build -ldflags '' -o bin/kaniko-demo main.go
INFO[0065] Taking snapshot of full filesystem...
INFO[0070] Pushing layer gcr.io/api-project-642841493686/kaniko-demo/cache:0ab16b2e8a90e3820282b9f1ef6faf5b9a083e1fbfe8a445c36abcca00236b4f to cache now
INFO[0144] Saving file src/bin/kaniko-demo for later use
INFO[0144] Deleting filesystem...
INFO[0145] No base image, nothing to extract
INFO[0145] Executing 0 build triggers
INFO[0145] cmd: EXPOSE
INFO[0145] Adding exposed port: 8080/tcp
INFO[0145] Checking for cached layer gcr.io/api-project-642841493686/kaniko-demo/cache:6ec16d3475b976bd7cbd41b74000c5d2543bdc2a35a635907415a0995784676d...
INFO[0146] No cached layer found for cmd COPY --from=build-env /src/bin/kaniko-demo /
INFO[0146] Unpacking rootfs as cmd COPY --from=build-env /src/bin/kaniko-demo / requires it.
INFO[0146] EXPOSE 8080
INFO[0146] cmd: EXPOSE
INFO[0146] Adding exposed port: 8080/tcp
INFO[0146] No files changed in this command, skipping snapshotting.
INFO[0146] ENTRYPOINT ["/kaniko-demo"]
INFO[0146] No files changed in this command, skipping snapshotting.
INFO[0146] COPY --from=build-env /src/bin/kaniko-demo /
INFO[0146] Taking snapshot of files...
INFO[0146] Pushing layer gcr.io/api-project-642841493686/kaniko-demo/cache:6ec16d3475b976bd7cbd41b74000c5d2543bdc2a35a635907415a0995784676d to cache now
If we run kaniko twice we can see how the cached layers are pulled instead of rebuilt.
INFO[0001] Resolved base name golang to build-env
INFO[0001] Retrieving image manifest golang
INFO[0001] Retrieving image golang
INFO[0004] Retrieving image manifest golang
INFO[0004] Retrieving image golang
INFO[0006] No base image, nothing to extract
INFO[0006] Built cross stage deps: map[0:[/src/bin/kaniko-demo]]
INFO[0006] Retrieving image manifest golang
INFO[0006] Retrieving image golang
INFO[0008] Retrieving image manifest golang
INFO[0008] Retrieving image golang
INFO[0010] Executing 0 build triggers
INFO[0010] Using files from context: [/workspace]
INFO[0010] Checking for cached layer gcr.io/api-project-642841493686/kaniko-demo/cache:0ab16b2e8a90e3820282b9f1ef6faf5b9a083e1fbfe8a445c36abcca00236b4f...
INFO[0012] Using caching version of cmd: RUN cd /src && make
INFO[0012] Unpacking rootfs as cmd ADD . /src requires it.
INFO[0049] Using files from context: [/workspace]
INFO[0049] ADD . /src
INFO[0049] Taking snapshot of files...
INFO[0049] RUN cd /src && make
INFO[0049] Found cached layer, extracting to filesystem
INFO[0051] Saving file src/bin/kaniko-demo for later use
INFO[0051] Deleting filesystem...
INFO[0052] No base image, nothing to extract
INFO[0052] Executing 0 build triggers
INFO[0052] cmd: EXPOSE
INFO[0052] Adding exposed port: 8080/tcp
INFO[0052] Checking for cached layer gcr.io/api-project-642841493686/kaniko-demo/cache:6ec16d3475b976bd7cbd41b74000c5d2543bdc2a35a635907415a0995784676d...
INFO[0054] Using caching version of cmd: COPY --from=build-env /src/bin/kaniko-demo /
INFO[0054] Skipping unpacking as no commands require it.
INFO[0054] EXPOSE 8080
INFO[0054] cmd: EXPOSE
INFO[0054] Adding exposed port: 8080/tcp
INFO[0054] No files changed in this command, skipping snapshotting.
INFO[0054] ENTRYPOINT ["/kaniko-demo"]
INFO[0054] No files changed in this command, skipping snapshotting.
INFO[0054] COPY --from=build-env /src/bin/kaniko-demo /
INFO[0054] Found cached layer, extracting to filesystem
In Kubernetes
To deploy to GCR we can use a service account and mount it as a Kubernetes secret, but when running on Google Kubernetes Engine (GKE) it is more convenient and safe to use the node pool service account.
When creating the GKE node pool the default configuration only includes read-only access to Storage API, and we need full access in order to push to GCR. This is something that we need to change under Add a new node pool – Security – Access scopes – Set access for each API – Storage – Full. Note that the scopes cannot be changed once the node pool has been created.
If the nodes have the correct service account with full storage access scope then we do not need to do anything extra on our kaniko pod, as it will be able to push to GCR just fine.
We can build a Docker image with kaniko and push it to Docker Hub or any other standard Docker registry.
Running kaniko from a Docker daemon does not provide much advantage over just running a docker build, but it is useful for testing or validation. It also helps understand how kaniko works and how it supports the different registries and authentication mechanisms.
git clone https://github.com/carlossg/kaniko-demo.git
cd kaniko-demo
# if you just want to test the build, no pushing
docker run \
    -v `pwd`:/workspace gcr.io/kaniko-project/executor:v1.0.0 \
    --no-push
Building by itself is not very useful, so we want to push to a remote Docker registry.
To push to DockerHub or any other username and password Docker registries we need to mount the Docker config.json file that contains the credentials. Caching will not work for DockerHub as it does not support repositories with more than 2 path sections (acme/myimage/cache), but it will work in Artifactory and maybe other registry implementations.
In Kubernetes we can manually create a pod that will do our Docker image build. We need to provide the build context, containing the same files that we would put in the directory used when building a Docker image with a Docker daemon. It should contain the Dockerfile and any other files used to build the image, ie. referenced in COPY commands.
Depending on where we want to push to, we will also need to create the corresponding secrets and config maps.
We are going to show examples building from a git repository as it will be the most typical use case.
Deploying to Docker Hub or a Docker registry
We will need the Docker registry credentials in a config.json file, the same way that we need them to pull images from a private registry in Kubernetes.
kaniko is a tool to build container images from a Dockerfile, similar to docker build, but without needing a Docker daemon. kaniko builds the images inside a container, executing the Dockerfile commands in userspace, so it allows us to build the images in standard Kubernetes clusters.
This means that in a containerized environment, be it a Kubernetes cluster, a Jenkins agent running in Docker, or any other container scheduler, we no longer need to use Docker in Docker nor do the build in the host system by mounting the Docker socket, simplifying and improving the security of container image builds.
Still, kaniko does not make it safe to run untrusted container image builds, but it relies on the security features of the container runtime. If you have a minimal base image that doesn’t require permissions to unpack, and your Dockerfile doesn’t execute any commands as the root user, you can run Kaniko without root permissions.
kaniko builds the container image inside a container, so it needs a way to get the build context (the directory where the Dockerfile and any other files that we want to copy into the container are) and to push the resulting image to a registry.
The build context can be a compressed tar in a Google Cloud Storage or AWS S3 bucket, a local directory inside the kaniko container, that we need to mount ourselves, or a git repository.
kaniko can be run in Docker, Kubernetes, Google Cloud Build (sending our image build to Google Cloud), or gVisor. gVisor is an OCI sandbox runtime that provides a virtualized container environment. It provides an additional security boundary for our container image builds.
Images can be pushed to any standard Docker registry but also Google GCR and AWS ECR are directly supported.
With Docker daemon image builds (docker build) we have caching. Each layer generated by RUN commands in the Dockerfile is kept and reused if the commands don’t change. In kaniko, because the image builds happen inside a container that is gone after the build we lose anything built locally. To solve this, kaniko can push these intermediate layers resulting from RUN commands to the remote registry when using the --cache flag.
In this series I will be covering using kaniko with several container registries.
Dedicated Kubernetes: You must create three Master nodes and one or multiple Worker nodes for the cluster
Managed Kubernetes: You only need to create Worker nodes for the cluster, and Alibaba Cloud Container Service for Kubernetes creates and manages Master nodes for the cluster
Multi-AZ Kubernetes
Serverless Kubernetes (beta): You are charged for the resources used by container instances. The amount of used resources is measured according to resource usage duration (in seconds).
You can run in multiple regions across the globe, however to run in the mainland China regions you need a Chinese id or business id. When running there you also have to face the issues of running behind The Great Firewall of China, that is currently blocking some Google services, such as Google Container Registry access, where some Docker images are hosted. DockerHub or Google Storage Service are not blocked.
Creating a Kubernetes Cluster
Alibaba requires several things in order to create a Kubernetes cluster, so it is easier to do it through the web UI the first time.
The following services need to be activated: Container Service, Resource Orchestration Service (ROS), RAM, and Auto Scaling service, and created the Container Service roles.
If we want to use the command line we can install the aliyun cli. I have added all the steps needed below in case you want to use it.
The last step is to create the cluster using the just created VPC, VSwitch and Keypair. It’s important to select the option Expose API Server with EIP (public_slb in the API json) to be able to connect to the API from the internet.
Another detail before being able to install applications that use PersistentVolumeClaims is to configure a default storage class. There are several volume options that can be listed with kubectl get storageclass.
NAME                          PROVISIONER     AGE
alicloud-disk-available       alicloud/disk   44h
alicloud-disk-common          alicloud/disk   44h
alicloud-disk-efficiency      alicloud/disk   44h
alicloud-disk-ssd             alicloud/disk   44h
Each of them matches the following cloud disks:
alicloud-disk-common: basic cloud disk (minimum size 5GiB). Only available in some zones (us-west-1a, cn-beijing-b,…)
alicloud-disk-efficiency: high-efficiency cloud disk, ultra disk (minimum size 20GiB).
alicloud-disk-ssd: SSD disk (minimum size 20GiB).
alicloud-disk-available: provides highly available options, first attempts to create a high-efficiency cloud disk. If the corresponding AZ’s efficient cloud disk resources are sold out, tries to create an SSD disk. If the SSD is sold out, tries to create a common cloud disk.
NOTE: Alibaba cloud disks must be more than 5GiB (basic) or 20GiB (SSD and Ultra)) so we will need to configure any service that is deployed with PVCs to have that size as a minimum or the PersistentVolumeprovision will fail.
Jenkins 中国巡演. 你好. The next two weeks I’ll be in China participating in the Continuous Delivery Summit, KubeCon and several Jenkins related events, and giving some talks:
Progressive Delivery: Continuous Delivery the Right Way
Progressive Delivery makes it easier to adopt Continuous Delivery, by deploying new versions to a subset of users and evaluating their correctness and performance before rolling them to the totality of the users, and rolled back if not matching some key metrics. Canary deployments is one of the techniques in Progressive Delivery, used in companies like Facebook to roll out new versions gradually. But good news! you don’t need to be Facebook to take advantage of it.
We will demo how to create a fully automated Progressive Delivery pipeline with Canary deployments and rollbacks in Kubernetes using Jenkins X and Flagger, a project that uses Istio and Prometheus to automate Canary rollouts and rollbacks.
Jenkins X: Next Generation Cloud Native CI/CD
Jenkins X is an open source CI/CD platform for Kubernetes based on Jenkins. It runs on Kubernetes and transparently uses on demand containers to run build agents and jobs, and isolate job execution. It enables CI/CD-as-code using automated deployments of commits and pull requests using Skaffold, Helm and other popular open source tools.
Jenkins X integrates Tekton, a new project created at Google and part of the Continuous Delivery Foundation, for serverless CI/CD pipelines. Jobs run in Kubernetes Pods using containers scaling up as needed, and down, so you don’t pay if no jobs are running.
Progressive Delivery is used by Netflix, Facebook and others to reduce the risk of deployments. But you can now adopt it when using Jenkins X.
Progressive Delivery is the next step after Continuous Delivery, where new versions are deployed to a subset of users and are evaluated in terms of correctness and performance before rolling them to the totality of the users and rolled back if not matching some key metrics.
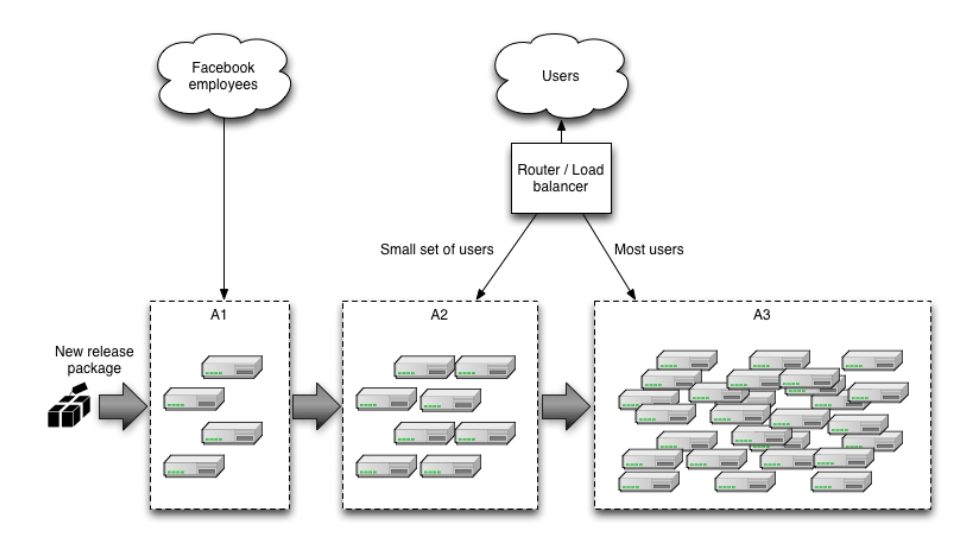
In particular we focused on Canary releases and made it really easy to adopt them in your Jenkins X applications. Canary releases consist on sending a small percentage of traffic to the new version of your application and validate there are no errors before rolling it out to the rest of the users. Facebook does it this way, delivering new versions first to internal employees, then a small percentage of the users, then everybody else, but you don’t need to be Facebook to take advantage of it!
If you already have an application in Jenkins X you know that you can promote it to the “production” environment with jx promote myapp --version 1.0 --env production. But it can also be automatically and gradually rolled it out to a percentage of users while checking that the new version is not failing. If that happens the application will be automatically rolled back. No human intervention at all during the process.
NOTE: this new functionality is very recent and a number of these steps will not be needed in the future as they will also be automated by Jenkins X.
As the first step three Jenkins X addons need to be installed:
This will enable Istio in the jx-production namespace for metrics gathering.
Now get the ip of the Istio ingress and point a wildcard domain to it (e.g. *.example.com), so we can use it to route multiple services based on host names. The Istio ingress provides the routing capabilities needed for Canary releases (traffic shifting) that the traditional Kubernetes ingress objects do not support.
kubectl -n istio-system get service istio-ingressgateway \
-o jsonpath='{.status.loadBalancer.ingress[0].ip}'
The cluster is configured, and it’s time to configure our application. Add a canary.yaml to your helm chart, under charts/myapp/templates.
Soon, both the canary.yaml and values.yaml changes won’t be needed when you create your app from one of the Jenkins X quickstarts, as they will be Canary enabled by default.
That’s it! Now when the app is promoted to the production environment with jx promote myapp --version 1.0 --env production it will do a Canary rollout. Note that the first time it is promoted it will not do a Canary as it needs a previous version data to compare to, but it will work from the second promotion on.
With the configuration in the values.yaml file above it would look like:
minute 1: send 10% of the traffic to the new version
minute 2: send 20% of the traffic to the new version
minute 3: send 30% of the traffic to the new version
minute 4: send 40% of the traffic to the new version
minute 5: send 100% of the traffic to the new version
If the metrics we have configured (request duration over 500 milliseconds or more than 1% responses returning 500 errors) fail, Flagger then will note that failure, and if it is repeated 5 times it will rollback the release, sending 100% of the traffic to the old version.
To get the Canary events run
$ kubectl -n jx-production get events --watch \
  --field-selector involvedObject.kind=Canary
LAST SEEN   FIRST SEEN   COUNT   NAME                                                  KIND     SUBOBJECT   TYPE     REASON   SOURCE    MESSAGE
23m         10d          7       jx-production-myapp.1584d8fbf5c306ee   Canary               Normal   Synced   flagger   New revision detected! Scaling up jx-production-myapp.jx-production
22m         10d          8       jx-production-myapp.1584d89a36d2e2f2   Canary               Normal   Synced   flagger   Starting canary analysis for jx-production-myapp.jx-production
22m         10d          8       jx-production-myapp.1584d89a38592636   Canary               Normal   Synced   flagger   Advance jx-production-myapp.jx-production canary weight 10
21m         10d          7       jx-production-myapp.1584d917ed63f6ec   Canary               Normal   Synced   flagger   Advance jx-production-myapp.jx-production canary weight 20
20m         10d          7       jx-production-myapp.1584d925d801faa0   Canary               Normal   Synced   flagger   Advance jx-production-myapp.jx-production canary weight 30
19m         10d          7       jx-production-myapp.1584d933da5f218e   Canary               Normal   Synced   flagger   Advance jx-production-myapp.jx-production canary weight 40
18m         10d          6       jx-production-myapp.1584d941d4cb21e8   Canary               Normal   Synced   flagger   Advance jx-production-myapp.jx-production canary weight 50
18m         10d          6       jx-production-myapp.1584d941d4cbc55b   Canary               Normal   Synced   flagger   Copying jx-production-myapp.jx-production template spec to jx-production-myapp-primary.jx-production
17m         10d          6       jx-production-myapp.1584d94fd1218ebc   Canary               Normal   Synced   flagger   Promotion completed! Scaling down jx-production-myapp.jx-production
Dashboard
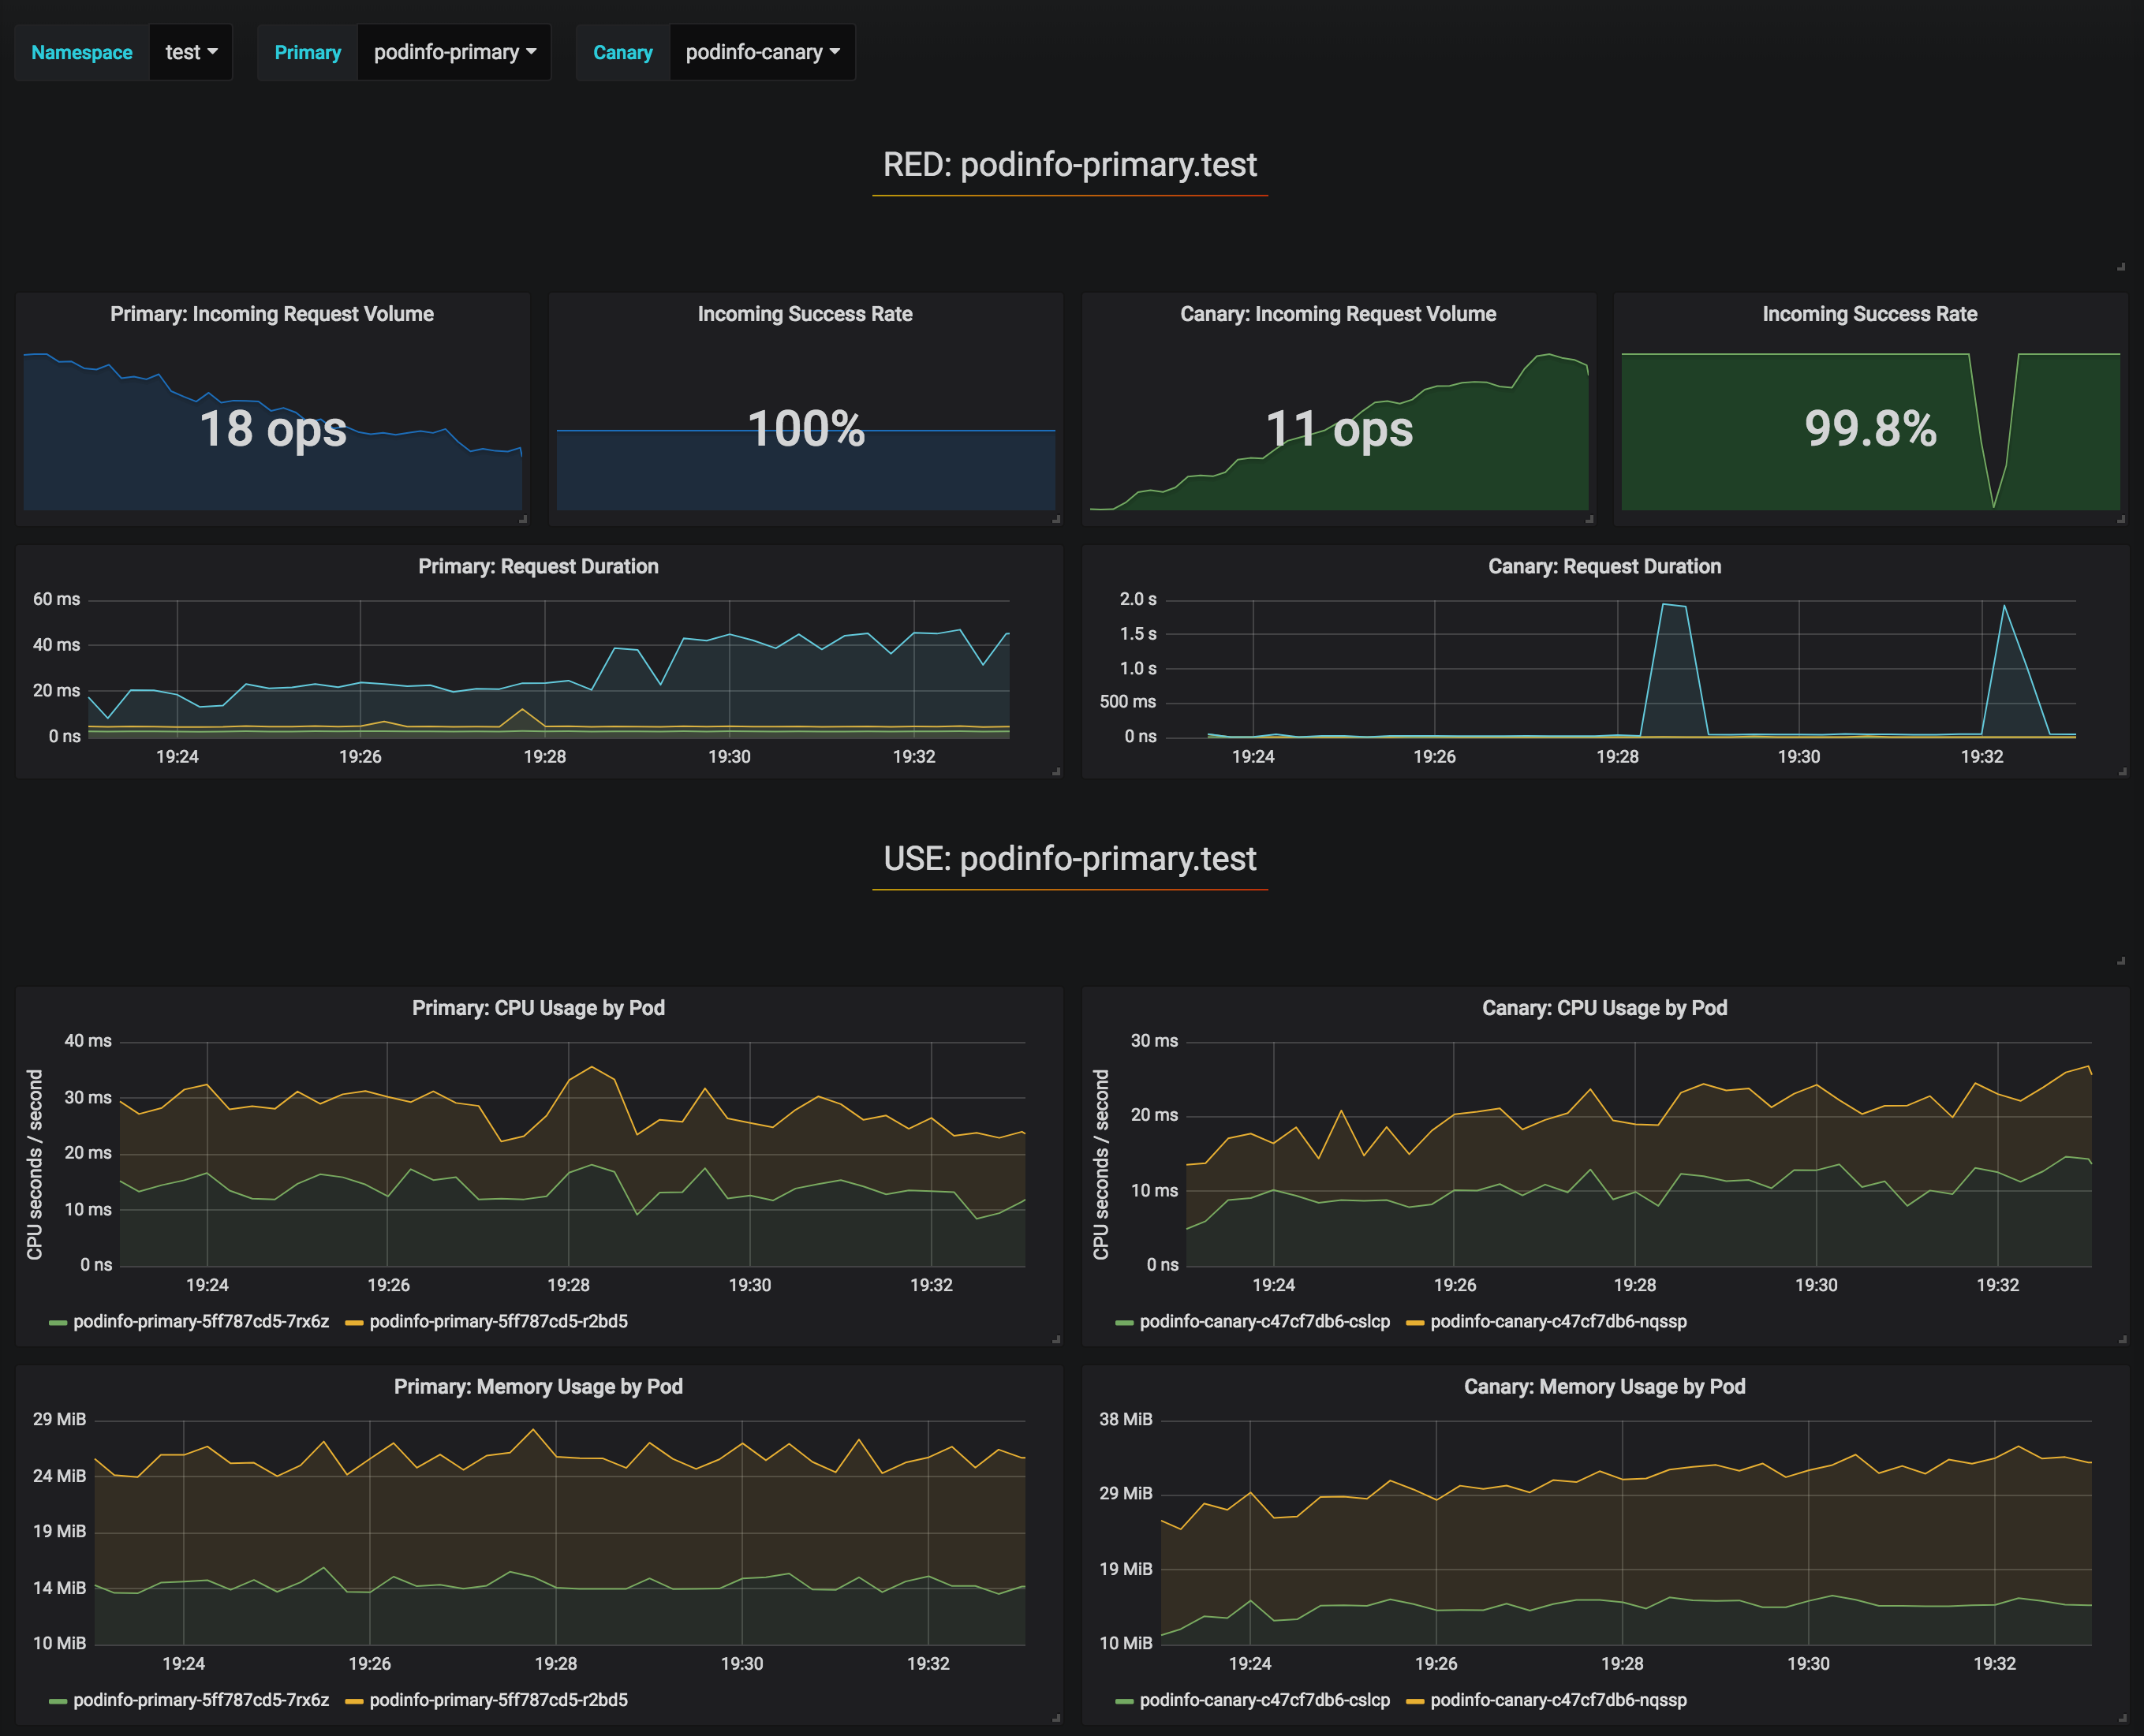
Flagger includes a Grafana dashboard for visualization purposes as it is not needed for the Canary releases. It can be accessed locally using Kubernetes port forwarding
Then accessing http://localhost:3000 using admin/admin, selecting the canary-analysis dashboard and
namespace: jx-production
primary: jx-production-myapp-primary
canary: jx-production-myapp
would provide us with a view of different metrics (cpu, memory, request duration, response errors,…) of the incumbent and new versions side by side.
Caveats
Note that Istio by default will prevent access from your pods to the outside of the cluster (a behavior that is expected to change in Istio 1.1). Learn how to control the Istio egress traffic.
If a rollback happens automatically because the metrics fail, the Jenkins X GitOps repository for the production environment becomes out of date, still using the new version instead of the old one. This is something planned to be fixed in next releases.

 Alibaba Cloud has a managed
  Jenkins 中国巡演. 你好. The next two weeks I’ll be in China participating in the Continuous Delivery Summit, KubeCon and several Jenkins related events, and giving some talks:
 Carlos Sanchez's Weblog