Most canary analysis is a threshold check: error rate > X%, latency > Yms, done. I wanted to see what happens if you replace that with something closer to how a human on-call engineer actually decides — read the logs, check the metrics, look at the events, and weigh them against each other.
So I built an AI-powered metric plugin for Argo Rollouts that can call an agent over A2A: a Lead Orchestrator agent that fans out to three specialists — a Log Analyst, a Metrics Analyst, and an Events Analyst — each independently investigating the canary vs. the stable version. They report back, debate, and the orchestrator resolves any disagreement into a single promote/abort verdict, running on Gemini via Google’s Antigravity agent framework, with some agents sandboxed on GKE Autopilot’s Agent Sandbox (gVisor) for isolation.
The most interesting part wasn’t the happy path — it was the debugging. A broken release gets caught in under a minute: two agents vote to promote based on clean resource metrics, but the Log Analyst — the one that actually read the logs — vetoes it, and the orchestrator sides with the evidence.
Multi-agent systems earn their keep when they’re allowed to disagree with each other, not just when they’re all pointed at the same task in parallel.
There are several flavours of “give a workload its own isolated runtime on Kubernetes” floating around right now. We wanted a head-to-head comparison — not a slide-deck comparison, but one with real numbers against a non-trivial workload that exercises identity routing, port forwarding, WebSocket upgrades, and a heavy long-lived process. Playwright driving Chromium is exactly that workload. This post walks through how we tested four sandboxing technologies — agent-sandbox, OpenShell, substrate, and KarsSandbox — against the same Playwright harness, what we found, and what each option is actually good at.
Most sandboxing demos use traefik/whoami or nginx. Both are useful for a smoke test and useless for telling sandboxing options apart, because they don’t stress anything. Real agent workloads do. Playwright gives us, in one process tree:
A long-lived stateful process (Chromium with ~6 child processes, hundreds of MB of memory).
A native WebSocket protocol (chromium.connect(wsEndpoint)), which requires HTTP upgrade handling end-to-end through the data plane.
A non-trivial cold-start cost that’s measurable and stable (Node + Chromium boot is ~3 seconds).
A real possibility of checkpoint/restore value — Chromium with a warm page tree is genuinely expensive to recreate, so the snapshot story is interesting to test rather than theoretical.
A clear correctness oracle — page.goto(url) either fetches the page or it doesn’t.
So each “test” in our harness is: instantiate a sandbox per tenant, get a Playwright client to connect over WebSocket, open a page, fetch a URL, measure each phase.
Stateless. CR deletion destroys both namespace and pod.
The first two are mechanically identical — same CRDs, same controller — and both can run with runc, gVisor (runsc), or Kata Containers by pointing the SandboxTemplate at the appropriate RuntimeClass. We ran them with the cluster default (runc) for the bench.
KarsSandbox takes a different approach: each sandbox gets its own dedicated namespace (not just a pod), providing stronger isolation boundaries and compatibility with Azure-specific runtime features like InferencePolicy for AI/GPU workloads. Unlike agent-sandbox’s warmpool model, KARS provisions sandboxes on-demand.
The interesting comparison isn’t really “container vs gVisor” — multiple models can do gVisor — it’s warmpool of pre-bound pods vs on-demand namespace provisioning vs substrate’s actor lifecycle with snapshot/restore.
The test harness
To make the comparison a bit similar we built a small proxy that abstracts the four backends behind one interface. Each backend implements Ensure(id) → Endpoint + Delete(id); the proxy handles caller identification, session caching, idle reaping, and WebSocket upgrade forwarding identically across all four. That way, when we compare bench numbers, we’re comparing the sandboxing technology, not four different ad-hoc client implementations.
┌─ test client pod ┐ ┌─ proxy ─────────┐ ┌─ backend ─────────┐
└──────────────────┘ │ reverse proxy │ │ - Actor (gRPC) │
│ idle reaper │ │ - KarsSandbox CR │
└────────┬────────┘ └─────────┬─────────┘
│ │
│ ┌─────────▼─────────┐
└──HTTP / WS upgrade─────▶│ Chromium sandbox │
└───────────────────┘
The proxy identifies callers by pod label: the test client sets metadata.labels.playwright-id on its Deployment, the proxy looks up the caller’s pod IP via a client-go informer and resolves it to that id. No agent-side SDK, no token plumbing — just one label. Each unique id gets its own sandbox.
Three scenarios per backend:
Scenario
Setup
Measures
cold
Delete any prior sandbox, then connect for the first time.
Connect again with the same id, sandbox still alive.
Steady-state cost: proxy hop + WS upgrade only.
restore
Out-of-band suspend (substrate) or wipe (sandboxclaim), then a fresh request.
The persistence story: does the sandbox come back faster than a cold start?
What the agent-sandbox / OpenShell flow looks like
Both back ends share the same CRD lifecycle: the proxy creates a SandboxClaim, the agent-sandbox controller picks a warm pod from the pool, binds it to the claim, and the proxy gets back an endpoint.
There is no checkpoint/restore in this model. A claim’s life is the sandbox’s life; deleting the claim destroys the pod, and the next call for the same id gets a fresh warm pod from the pool. The “restore” scenario therefore re-creates the claim and behaves identically to cold. The interesting question this design answers well is: how cheap can a cold-start be when you have warm capacity pre-allocated? Answer below.
OpenShell’s flow is the same shape; the only difference is the added process isolation and OpenShell features.
What substrate’s flow looks like
Substrate is a different beast. Each tenant gets an “Actor” living inside a gVisor sandbox on a worker pod. The data plane is atenet-router (Envoy with an ext_proc filter) which dispatches to the right worker pod by Host: <actor-id>.actors.resources.substrate.ate.dev. Actor lifecycle (Create, Resume, Suspend, Delete) is a gRPC API on ate-api-server.
In principle, substrate gives you persistent sandboxes — suspend an actor mid-session, restore it later, and Chromium picks up where it left off with all its in-memory state intact. That’s the headline feature you don’t get from container-with-warmpool or namespace-scoped sandboxes. Whether it actually works is the interesting test result.
What KarsSandbox’s flow looks like
KarsSandbox uses Azure’s KARS (Kubernetes Azure Runtime Sandboxes) controller to provision a dedicated namespace per tenant. Each KarsSandbox CR (kars.azure.com/v1alpha1, runtime: BYO) triggers the controller to create both a namespace and the sandbox pod within it. The proxy polls status.phase=Running then locates the pod IP via the CoreV1 API.
Unlike agent-sandbox’s warmpool or substrate’s actor pool, KARS provisions resources on-demand. The tradeoff is no pre-warmed capacity, but you get namespace-level isolation that plays well with Azure-specific features like InferencePolicy for GPU scheduling.
State across runs: None, like agent-sandbox. A KarsSandbox CR creates a dedicated namespace and pod; when the CR is deleted (idle reap or explicit Delete), both the namespace and pod are destroyed by the KARS controller. The next caller for the same id gets a brand-new isolated sandbox. Reuse only happens while the sandbox is alive.
RBAC requirements: The proxy needs additional permissions beyond the base ClusterRole:
- apiGroups: ["kars.azure.com"]
  resources: ["karssandboxes"]
  verbs: ["get", "list", "watch", "create", "delete"]
- apiGroups: ["kars.azure.com"]
  resources: ["karssandboxes/status"]
  verbs: ["get"]
- apiGroups: [""]
  resources: ["pods"]
  verbs: ["get", "list"]  # To locate pod IP after KarsSandbox is Running
See deploy/examples/kars/ for complete deployment manifests including proxy configuration, RBAC patches, and InferencePolicy examples.
The numbers
Run on Colima 16 GiB / 6 CPU, kind 1.33, arm64. All scenarios pass (KARS results pending).
Container-with-warmpool wins on cold-start by ~6×. agent-sandbox and OpenShell come in ~580–600ms cold; substrate is 3.6s. The warmpool model amortizes container start-up at provisioning time; substrate has pre-warmed worker pods, but the user workload (Node + Chromium) still boots cold inside the gVisor sandbox on every cold-start.
All three are essentially free at warm. 60–100ms total at warm — the proxy hop and WS handshake dominate. The choice of backend doesn’t matter once the sandbox is up.
Substrate’s “restore” is fast (198ms) for the wrong reason. The bench’s suspend leaves the worker pod hot — the OCI bundle is already extracted on disk — so the boot-from-spec restore reuses cached state. With working snapshot restore, this would be the most interesting cell in the table; today, it doesn’t prove much.
The 3.6s substrate cold-start isn’t just gVisor. A meaningful chunk of it is Node + Chromium boot itself, plus the actor lifecycle workflow (CreateActor → AssignWorker → AteletRestore → URPC into the sentry). Running agent-sandbox under gVisor via RuntimeClass would add some runsc-specific overhead to its ~580ms cold, but not the full 3s gap — the rest is substrate’s per-tenant actor setup vs agent-sandbox’s “the warm pod already exists, just bind it” model.
When to use which
Based on what testing actually surfaced:
agent-sandbox is the safe default for browser-style workloads. Sub-second cold-start, trivial to operate (one CRD, one controller, one warmpool per template), and the model is easy to reason about — claim’s life is the pod’s life. If you need gVisor or Kata isolation, swap the RuntimeClass on the SandboxTemplate; you keep the same controller and the same warmpool semantics. The OpenShell flavor demonstrates how easy it is to fork the image story without touching the controller.
OpenShell adds little value with agent-sandbox gVisor isolation. Adds process isolation when using default RuntimeClass.
substrate is the right answer when you need per-tenant snapshot/ restore — suspend an actor mid-session, ship the checkpoint elsewhere, restore later with browser state intact. That’s the capability nothing else in this comparison offers. gVisor isolation alone is not the differentiator (agent-sandbox can do that too via RuntimeClass); the actor lifecycle + S3-backed snapshots is. Today the snapshot path needs work in our environment, so we’re paying substrate’s per-tenant boot cost without yet getting the persistence benefit; once snapshot restore is reliable end-to-end, the substrate story becomes very compelling.
KarsSandbox is the choice for Azure/AKS environments where you need stronger isolation boundaries than pod-level (each tenant gets its own namespace) or integration with Azure-specific features like InferencePolicy for AI/GPU workloads. The on-demand provisioning model means no warmpool capacity planning, but cold-starts will be slower than agent-sandbox since KARS must create both namespace and pod from scratch. Best fit for multi-tenant scenarios on AKS where namespace-level RBAC and resource quotas matter, or when targeting Azure’s runtime sandbox extensions.
Try it yourself
git clone https://github.com/carlossg/playwright-k8s-sandbox
cd playwright-k8s-sandbox
./test/harness.sh up         # spin up the agent-sandbox kind cluster
./test/harness.sh up-kars    # spin up the KARS kind cluster
./test/bench.sh all          # run cold/warm/restore against all backends
./test/bench.sh kars         # run KARS-specific benchmarks
For substrate you’ll also need its own kind cluster and the ate.dev control plane installed (hack/install-ate-kind.sh in the substrate repo). The full architecture deep-dive — including the sequence diagrams, identity model, idle-reap policy, and the bench methodology — is at docs/ARCHITECTURE.md.
KARS test harness commands:
./test/harness.sh up-kars      # Create KARS cluster with controller
./test/harness.sh test kars    # Run integration tests
./test/bench.sh kars           # Run cold/warm/restore benchmarks
./test/harness.sh down-kars    # Cleanup
If you’re picking a Kubernetes sandboxing technology for a new workload, the meta-takeaway is: build a small harness around your actual workload (whatever it is), put it through cold/warm/restore on the candidates, and let the numbers + the debugging stories decide. The harness in this repo is built around Playwright; the same shape works for anything with a WebSocket or HTTP frontend.
We travel to see the world, but we track our travels to remember it. For years, I relied on TripIt to keep my travel history organized. But the API is no longer available and in their UI is hard to find older trips and get cool stats and visualizations.
Instead of losing that history, I spent a recent holiday afternoon building a custom solution: a TripIt Data Visualization site.
The initial motivation was simple: data ownership. I knew I could still get a JSON export of my data (thanks to GDPR), but a JSON file isn’t exactly “visual.”
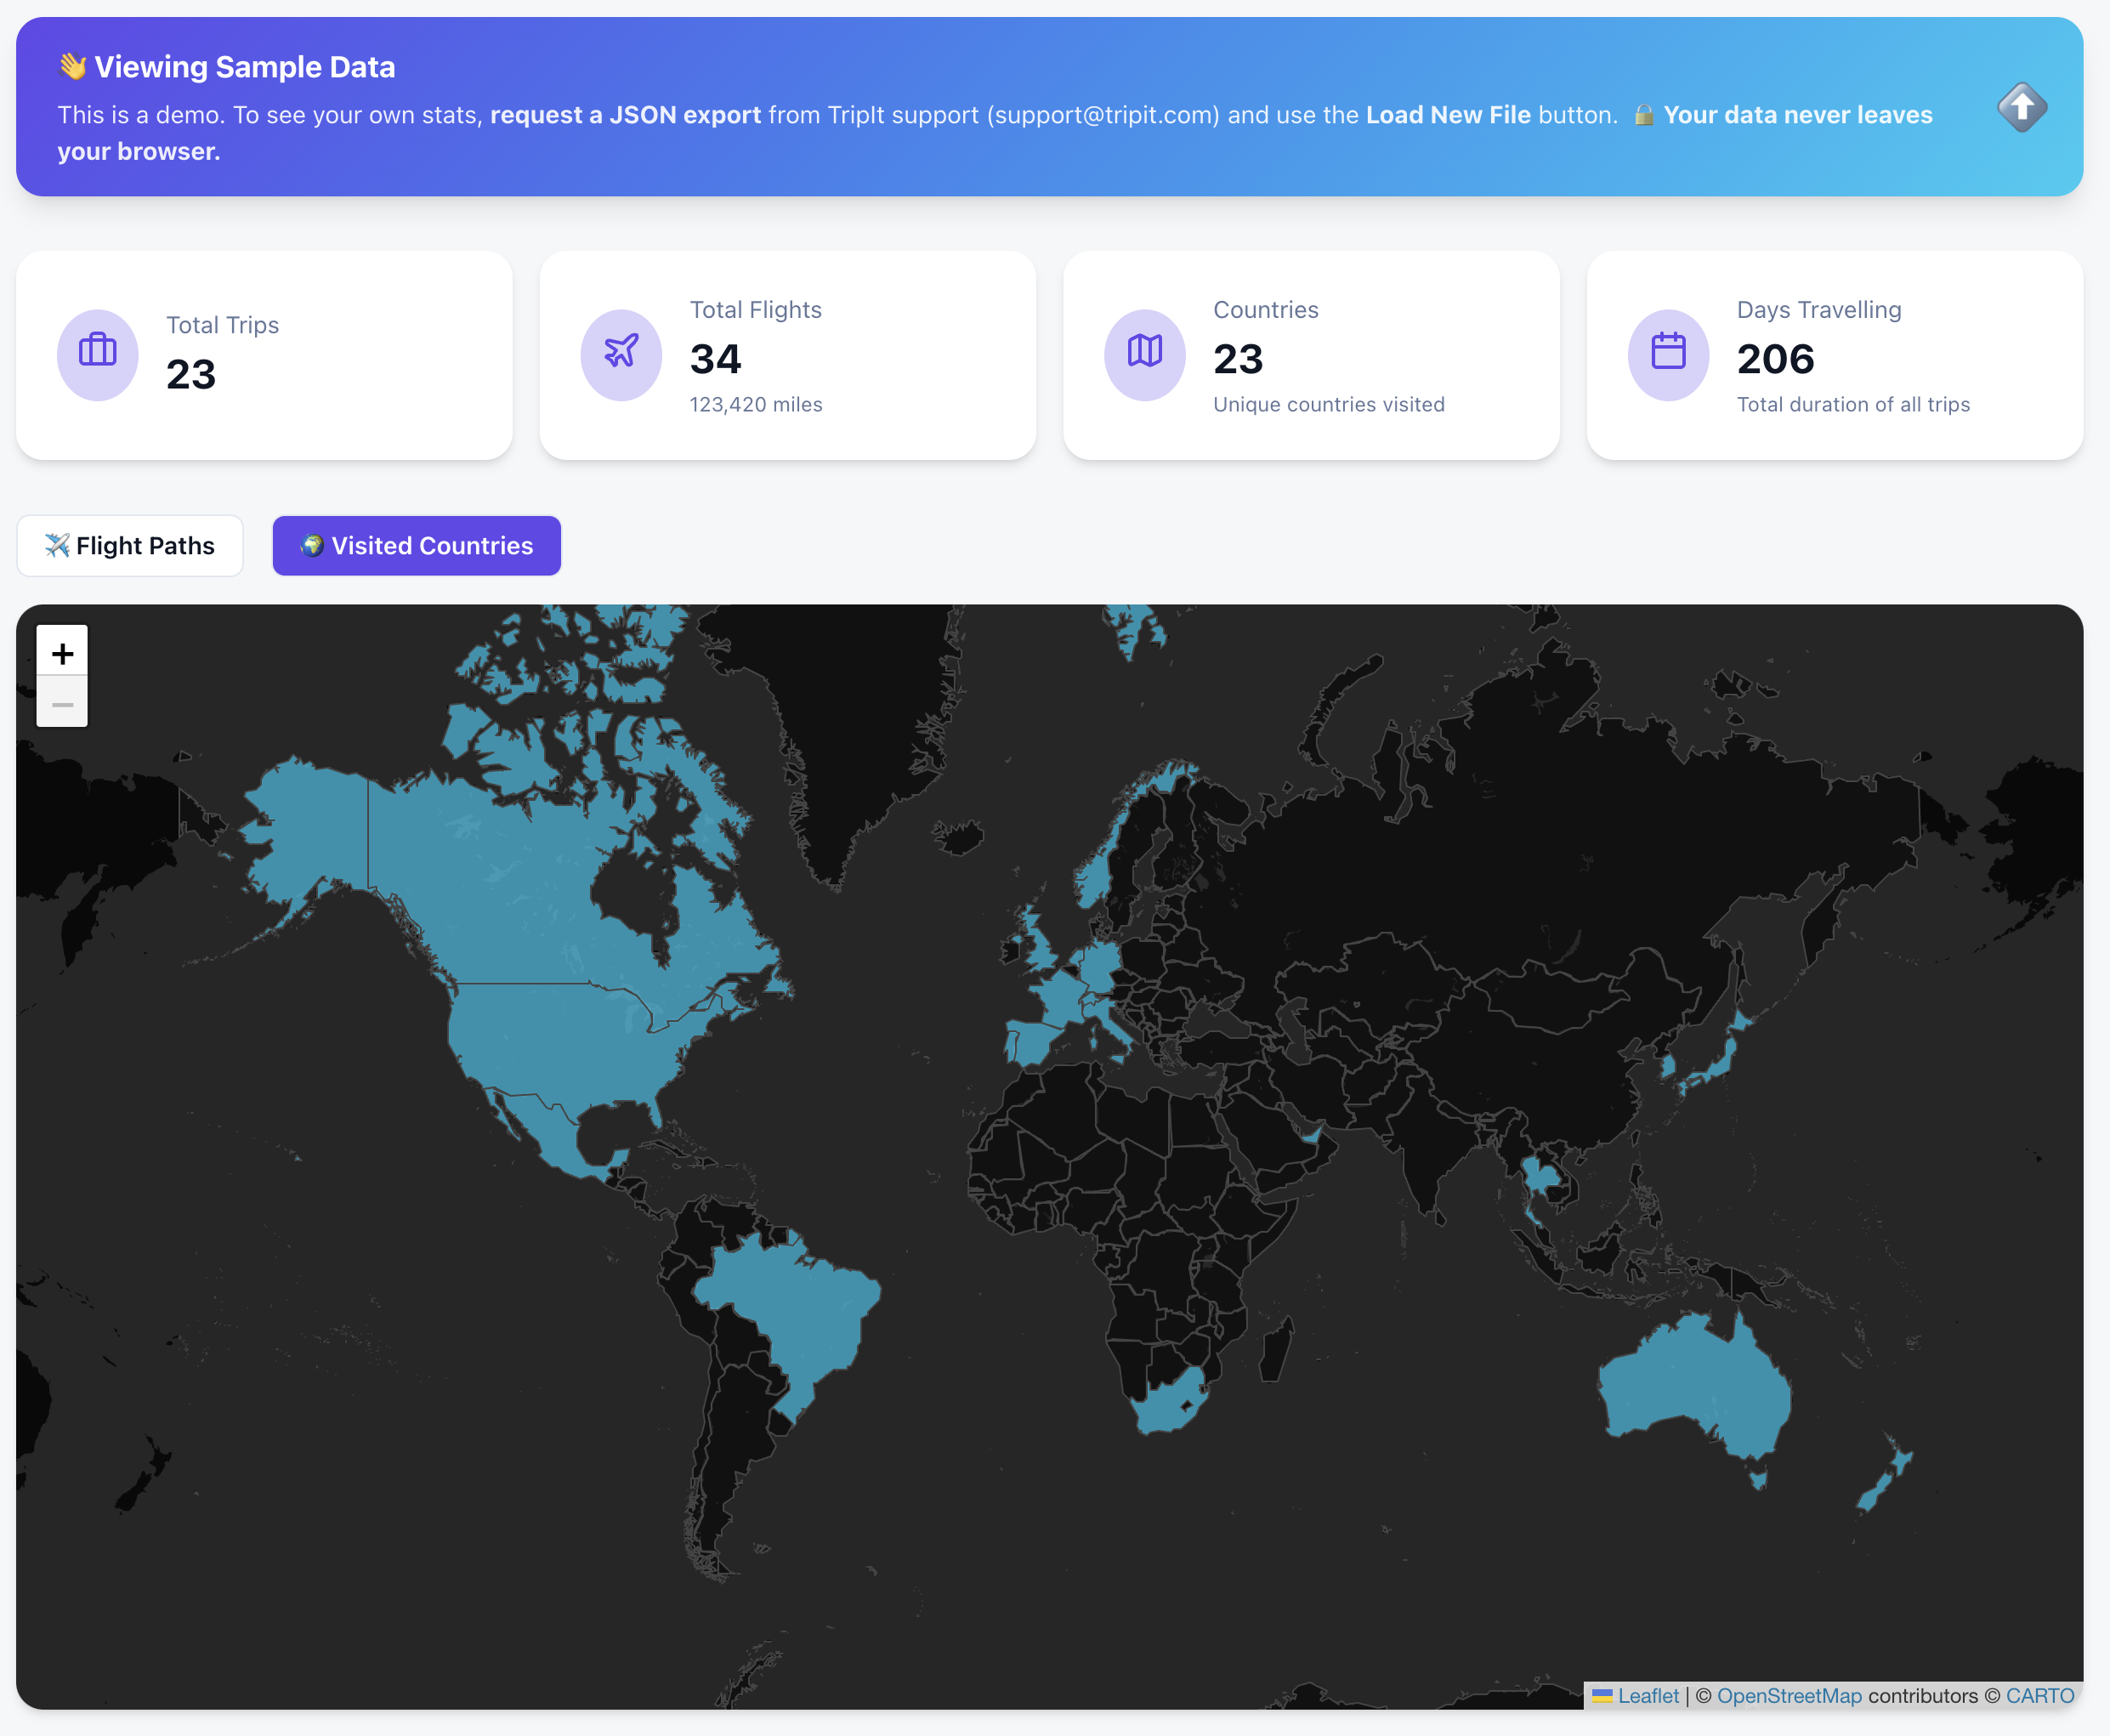
🌍 See it in Action (Try the Sample Data)
You don’t need your own data export to see how it works. I’ve included a “Sample Data” mode so anyone can explore the dashboard immediately.
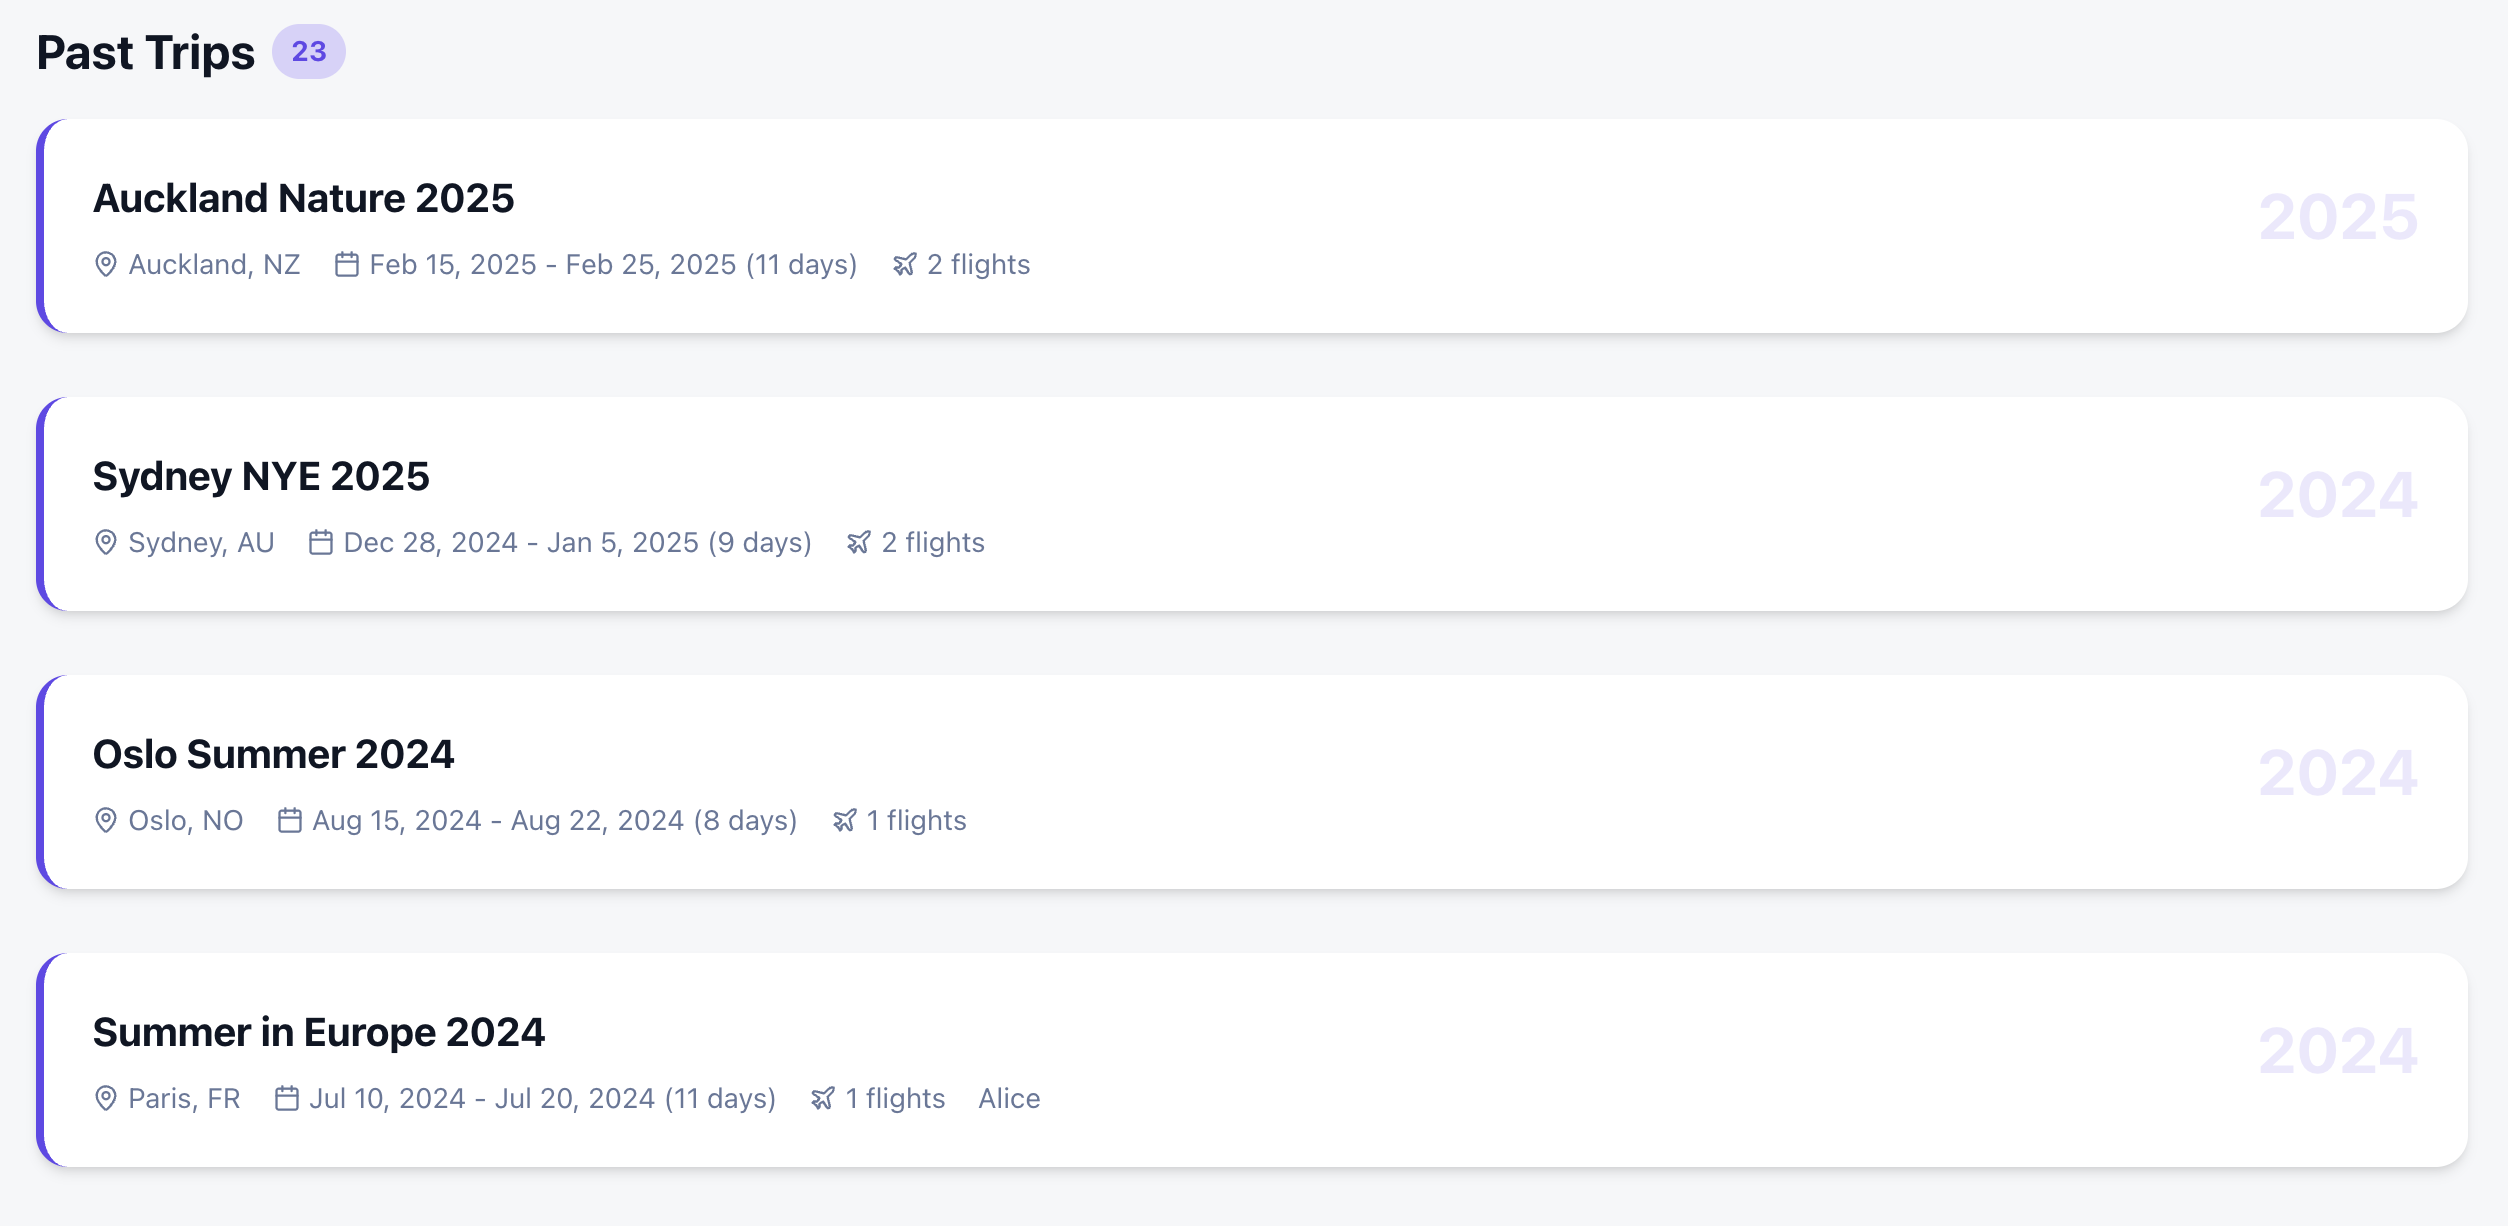
I wanted more than just a list of past trips. I wanted a comprehensive dashboard that felt like a mix of the best travel apps out there:
Countries Visited: A high-level view of global coverage.
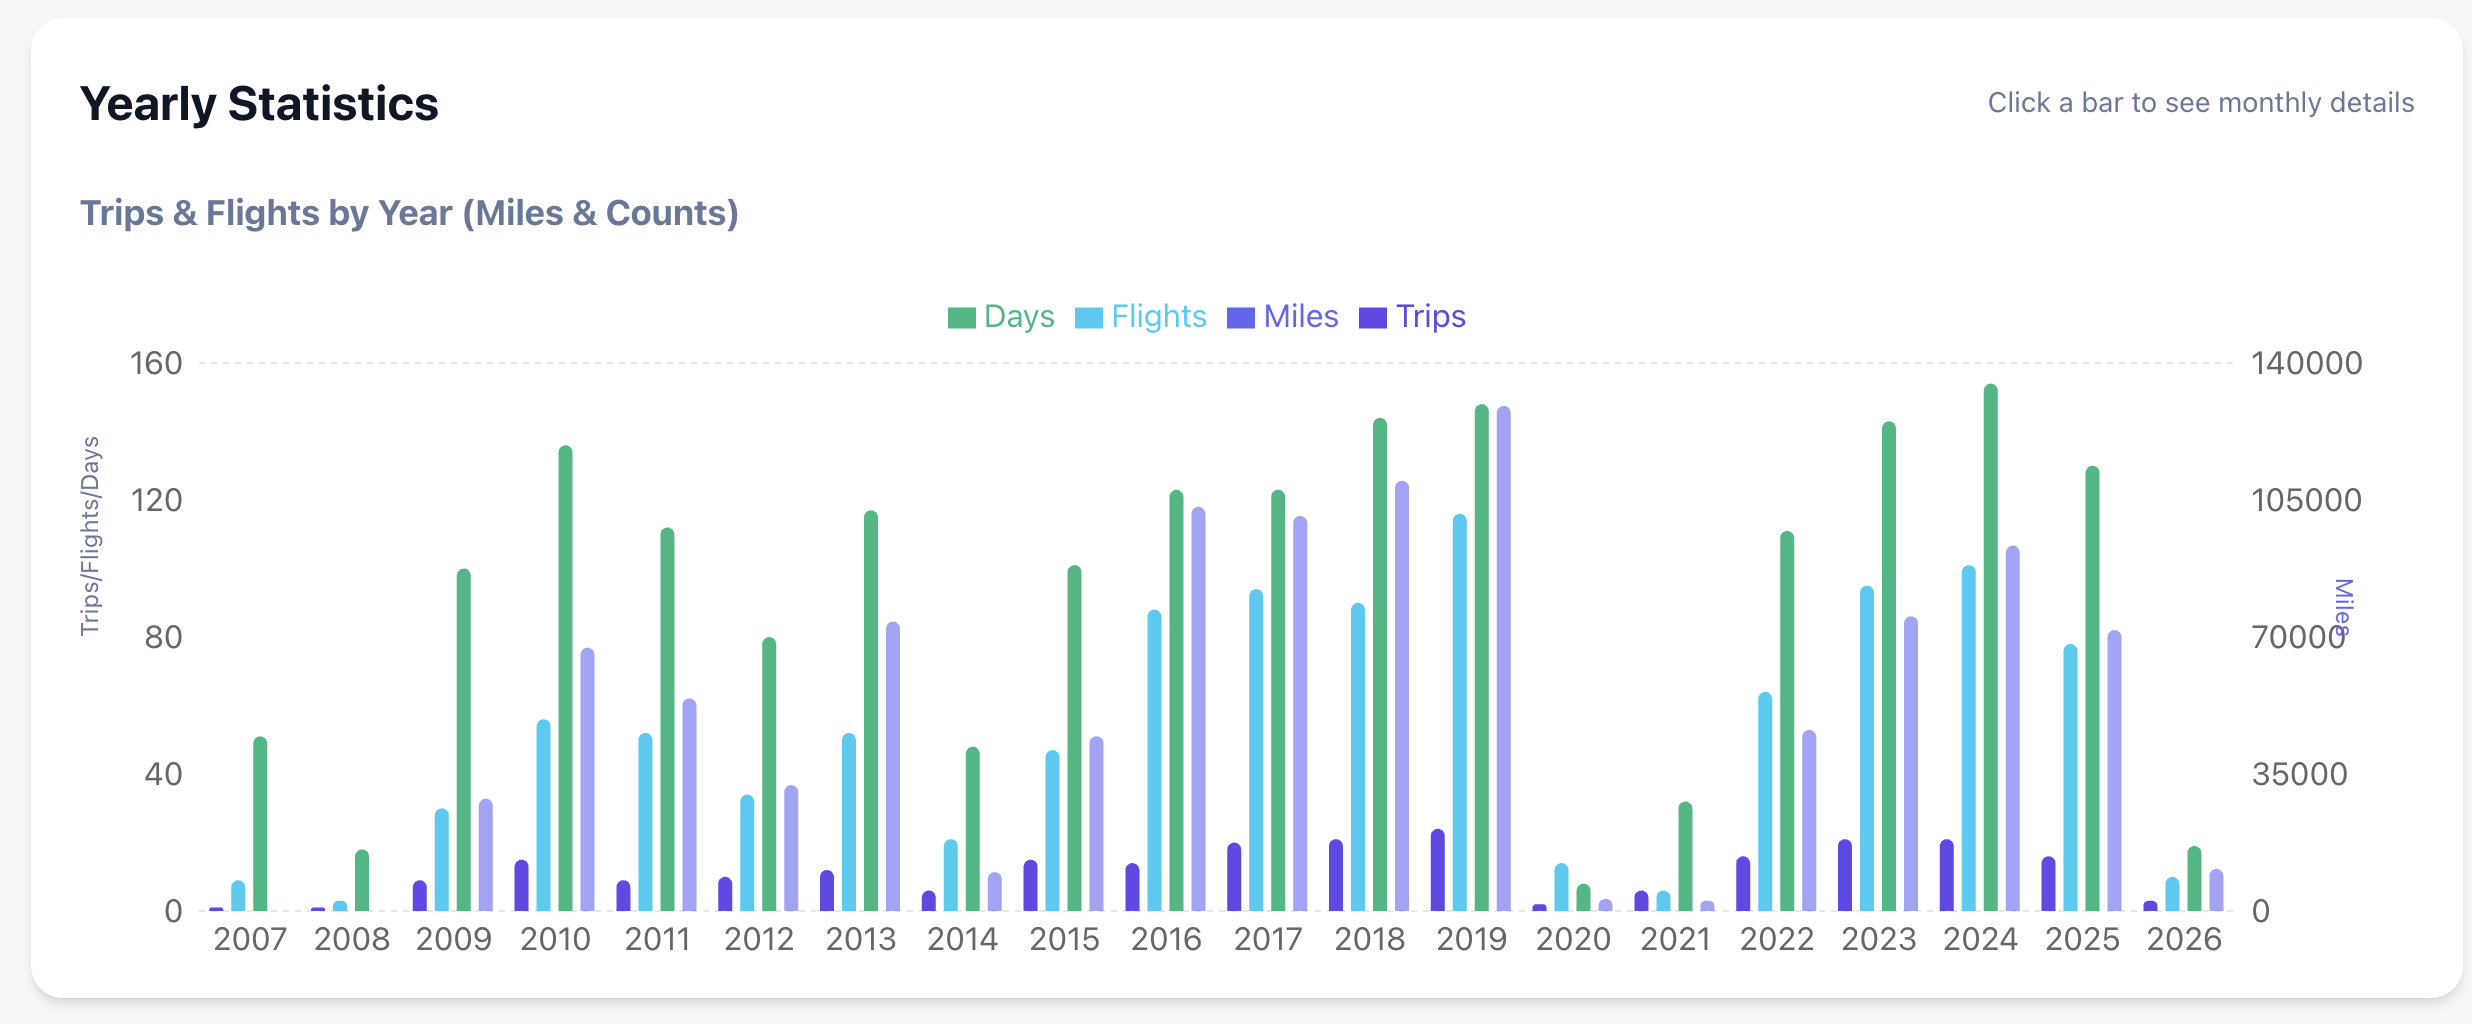
Deep Statistics: Yearly and monthly breakdowns of flights, miles, and airline preferences.
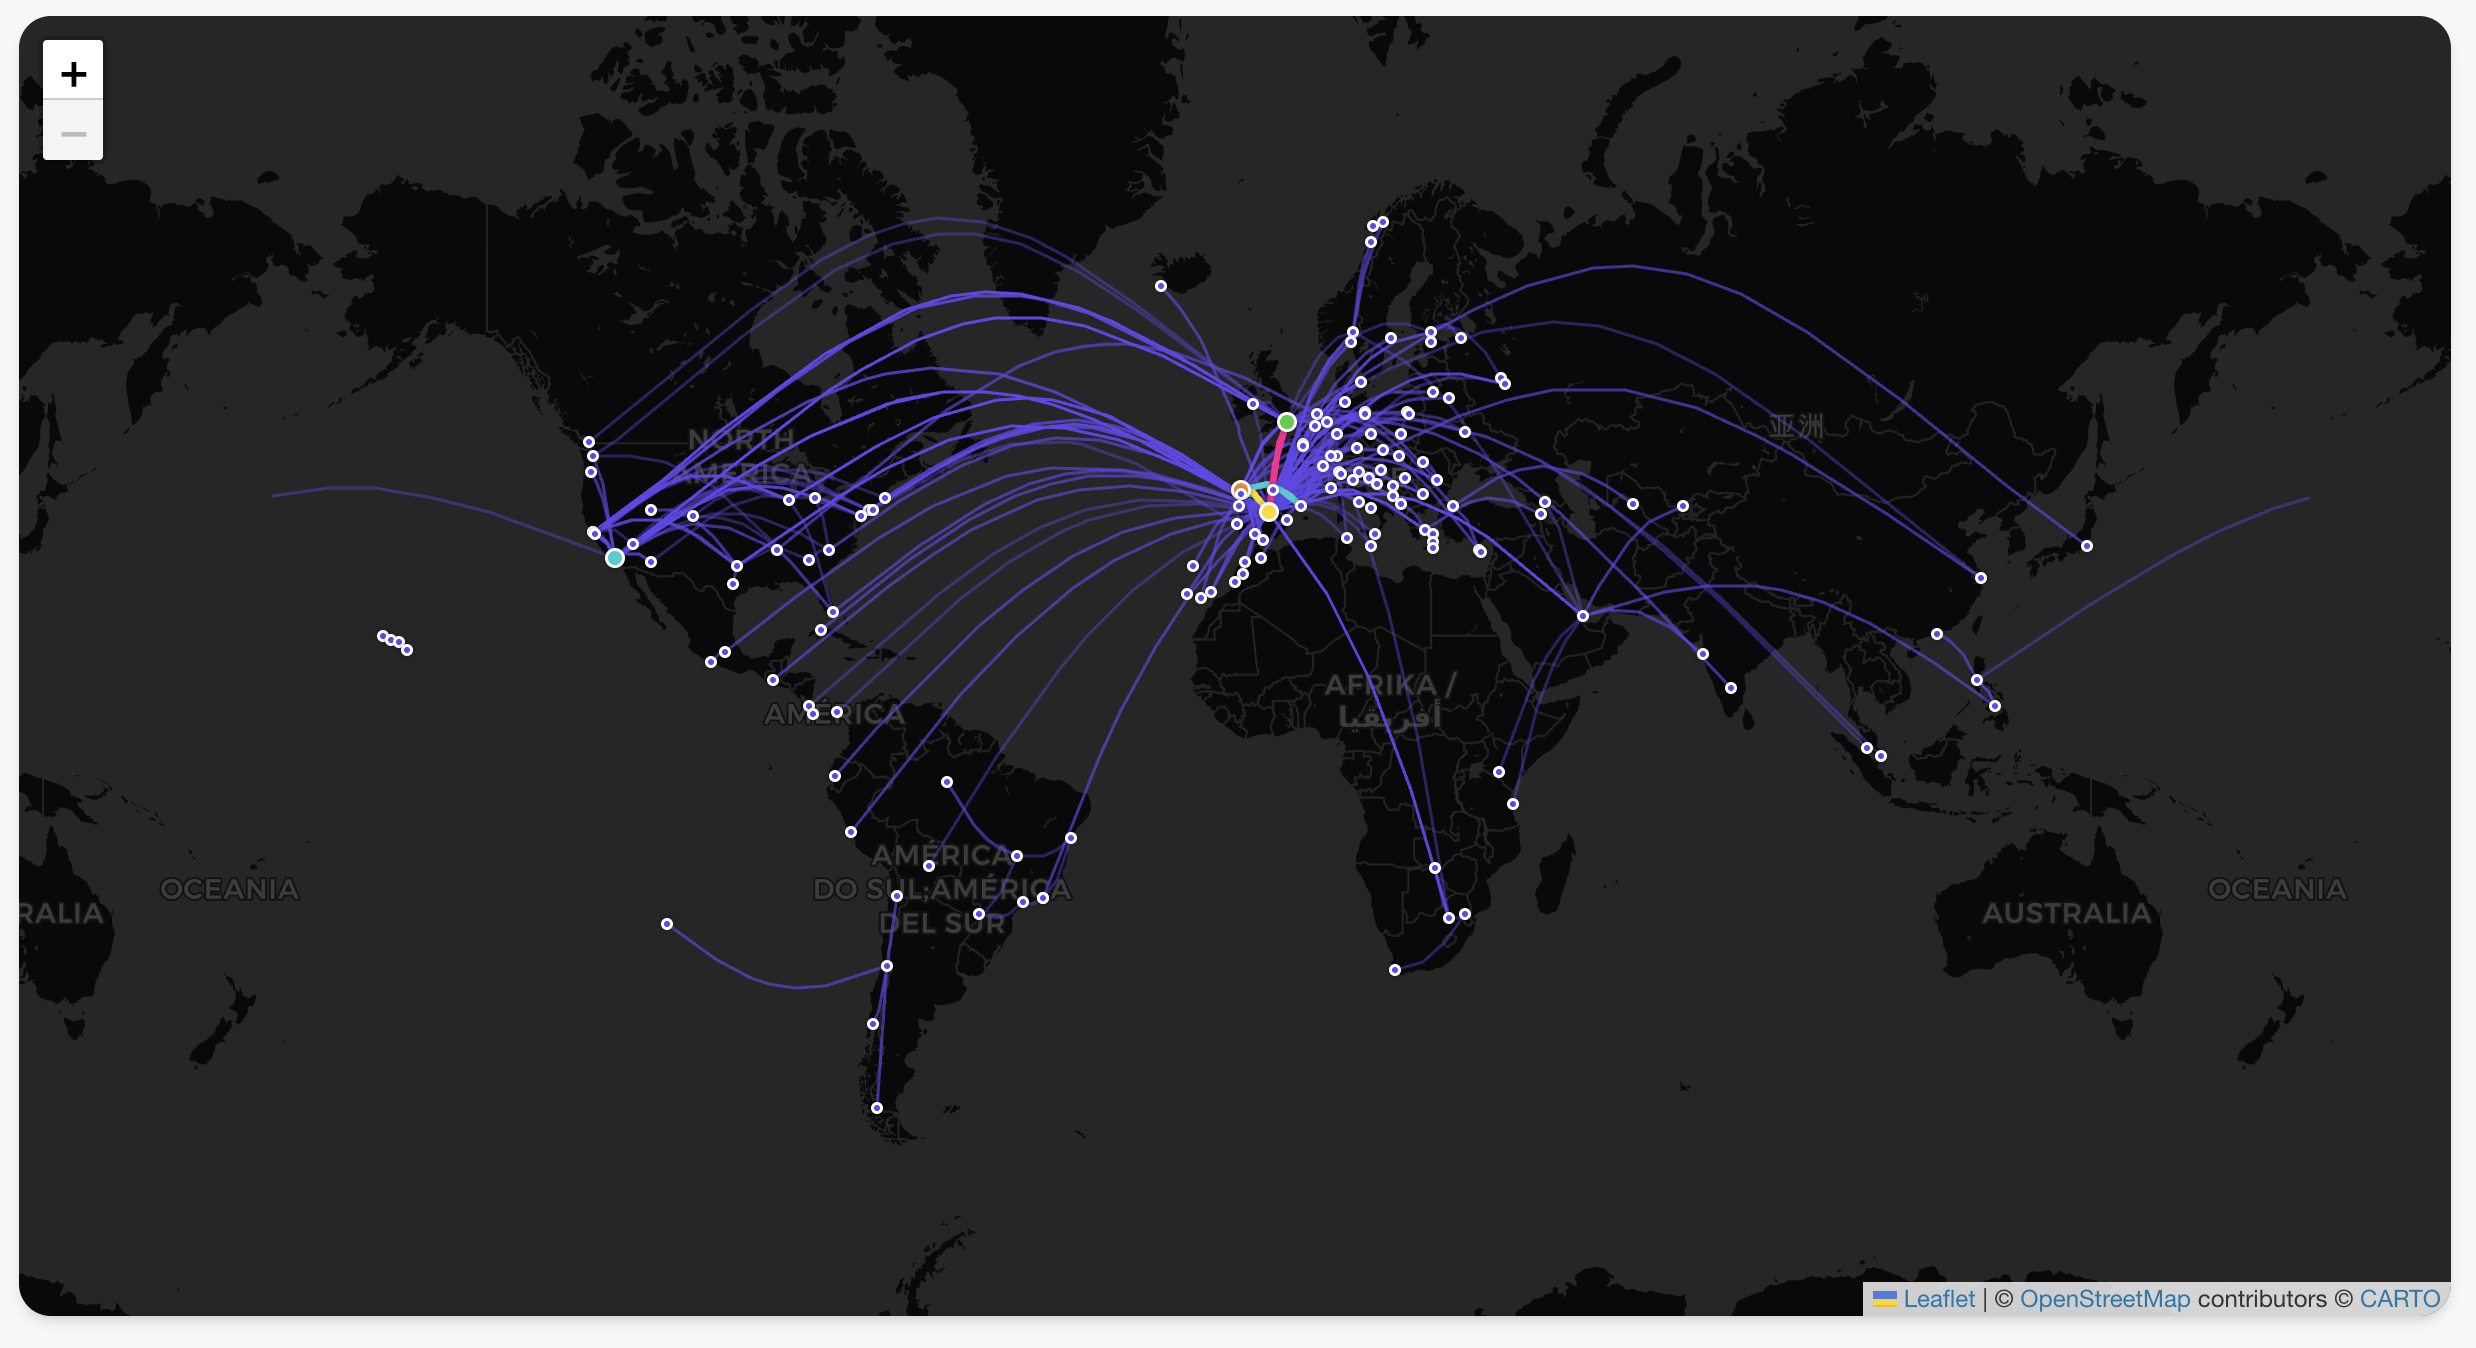
Interactive Flight Paths: View every take-off and landing as a beautiful arc on a global map.
Country Tracking: Automatically highlights every country you’ve visited based on your trip history.
Deep-Dive Statistics: Automated breakdowns of your travels by year, month, and even specific airlines.
Privacy-First Architecture: Your data never leaves your browser. There is no backend server storing your history; it’s all processed locally using your tripit export.
Zero Friction: Don’t have your data yet? You can explore every feature using the Gemini generated Sample Data .
The Secret Sauce: Building with Google Antigravity & Gemini
The most remarkable part of this project wasn’t the code itself, but how fast it came together. The entire project took just a few hours, and complex visualizations were trivial to add. Which also hooks you into adding more and more features as it is too easy!
I used the Antigravity browser, which allowed for a feedback loop with Gemini. Instead of manually debugging CSS or layout issues, I could:
Ask Gemini for a design change or a new feature.
The AI would “see” the current state of the app via screenshots.
It would provide the fix or the code block instantly based on the visual context.
This “visual-first” development meant I could spend more time on the logic of the data and less time wrestling with the UI.
Privacy First: Your Data Stays Yours
I wanted to ensure this tool was 100% private.
Since there is no API, you need to request a JSON export from TripIt (thank you, GDPR!).
Your data never leaves your browser. It’s processed locally, visualized, and saved for the next time you open the page.
By now, most of us have experimented with AI coding. But while tools like Cursor have mastered the “co-pilot” experience—keeping you in the flow of writing code—Google Antigravity (released late 2025) is trying something different. It is an agentic IDE where your primary job is reviewing “Artifacts” rather than syntax.
One of the killer features is the Browser Integration.
The Browser as a “Feedback Loop”
In Antigravity, the built-in browser isn’t just for documentation; it’s a sandbox for the AI agents. When an agent implements a UI change or a new route, it doesn’t just hope the code works. It can:
Self-Verify: Open a headless window to check if a component actually renders.
Visual Debugging: Use DOM inspection to fix styling bugs that text-based models usually struggle with.
Artifact Generation: It produces browser recordings and screenshots so you can verify the “Mission” was successful without having to manually run the build yourself.
It’s less about “the AI browsing the web” and more about the AI having a way to prove its work to you before you merge.
The Reality of the Free Tier: Knowing Your Quotas
The biggest change in the 2026 version of Antigravity is the move to Weekly Quotas. Instead of a daily reset that might cut you off mid-task, you now have a larger “bucket” of usage that refreshes weekly.
Here is how those limits are structured for Free Tier users:
Category
Quota Type
Key Detail
Gemini Models
Dedicated per Model
Gemini 3 Pro and Gemini 3 Flash each have their own separate weekly allowance. If you run out of Pro, you can still use Flash for lighter tasks.
Claude Models
Shared Pool
All non-Google models (Claude 3.5/4.5 Sonnet and Opus) share a single combined bucket. High-intensity work with Opus will drain the same quota you use for Sonnet.
Completions
Unlimited
Standard inline tab-completions do not count toward your weekly agent/chat limits.
The Strategy: Staggering Your Usage
Because of this “separate vs. shared” structure, the smartest way to use Antigravity is to stagger your models:
Use Gemini 3 Pro for your initial architectural planning and browser-heavy UI tasks.
Switch to the Claude pool only when you need a “second opinion” on complex logic or specific refactoring patterns where Anthropic’s reasoning shines.
Save Gemini 3 Flash for documentation questions and basic unit test generation to preserve your “Heavy Reasoning” buckets.
Final Verdict
Antigravity isn’t a “Cursor killer”—it’s a different workflow. While Cursor is for when you want to be the pilot, Antigravity is for when you want to be the air traffic controller. Just keep a close eye on your Claude shared pool; if you’re not careful, a single complex feature build on Monday can leave you without Claude access for the rest of the week.
Rolling out changes to all users at once in production is risky—we’ve all learned this lesson at some point. But what if we could combine progressive delivery techniques with AI agents to automatically detect, analyze, and fix deployment issues? In this article, I’ll show you how to implement self-healing rollouts using Argo Rollouts and agentic AI to create a fully automated feedback loop that can fix production issues while you grab a coffee.
The Case for Progressive Delivery
Progressive Delivery is a term that encompasses deployment strategies designed to avoid the pitfalls of all-or-nothing deployments. The concept gained significant attention after the CrowdStrike incident, where a faulty update took down a substantial portion of the internet. Their post-mortem revealed a crucial lesson: they should have deployed to progressive “rings” or “waves” of customers, with time between deployments to gather metrics and telemetry.
The key principles of progressive delivery are:
Avoiding downtime: Deploy changes gradually with quick rollback capabilities
Limiting the blast radius: Only a small percentage of users are affected if something goes wrong
Shorter time to production: Safety nets enable faster, more confident deployments
As I like to say: “If you haven’t automatically destroyed something by mistake, you’re not automating enough.”
Progressive Delivery Techniques
Rolling Updates
Kubernetes provides rolling updates by default. As new pods come up, old pods are gradually deleted, automatically shifting traffic to the new version. If issues arise, you can roll back quickly, affecting only the percentage of traffic that hit the new pods during the update window.
Blue-Green Deployment
This technique involves deploying a complete copy of your application (the “blue” version) alongside the existing production version (the “green” version). After testing, you switch all traffic to the new version. While this provides quick rollbacks, it requires twice the resources and switches all traffic at once, potentially affecting all users before you can react.
Canary Deployment
Canary deployments offer more granular control. You deploy a new version alongside the stable version and gradually increase the percentage of traffic going to the new version—perhaps starting with 5%, then 10%, and so on. You can route traffic based on various parameters: internal employees, IP ranges, or random percentages. This approach allows you to detect issues early while minimizing user impact.
Feature Flags
Feature flags provide even more granular control at the application level. You can deploy code with new features disabled by default, then enable them selectively for specific user groups. This decouples deployment from feature activation, allowing you to:
Ship faster without immediate risk
Enable features for specific customers or user segments
Quickly disable problematic features without redeployment
You can implement feature flags using dedicated services like OpenFeature or simpler approaches like environment variables.
Progressive Delivery in Kubernetes
Kubernetes provides two main architectures for traffic routing:
Service Architecture
The traditional approach uses load balancers directing traffic to services, which then route to pods based on labels. This works well for basic scenarios but lacks flexibility for advanced routing.
Ingress Architecture
The Ingress layer provides more sophisticated traffic management. You can route traffic based on domains, paths, headers, and other criteria, enabling fine-grained control essential for canary deployments. Popular ingress controllers include:
Argo Rollouts is a Kubernetes controller that provides advanced deployment capabilities including blue-green deployments, canary releases, analysis, and experimentation. It’s a powerful tool for implementing progressive delivery in Kubernetes environments.
How Argo Rollouts Works
The architecture includes:
Rollout Controller: Manages the deployment process
Rollout Object: Defines the deployment strategy and analysis configuration
Analysis Templates: Specify metrics and success criteria
Replica Sets: Manages stable and canary versions with automatic traffic shifting
When you update a Rollout, it creates separate replica sets for stable and canary versions, gradually increasing canary pods while decreasing stable pods based on your defined rules. If you’re using a service mesh or advanced ingress, you can implement fine-grained routing—sending specific headers, paths, or user segments to the canary version.
Analysis Options
Argo Rollouts supports various analysis methods:
Prometheus: Query metrics to determine rollout health
Kubernetes Jobs: Run custom analysis logic—check databases, call APIs, or perform any custom validation
The experimentation feature is particularly interesting. We considered using it to test Java upgrades: deploy a new Java version, run it for a few hours gathering metrics on response times and latency, then decide whether to proceed with the full rollout—all before affecting real users.
Adding AI to the Mix
Now, here’s where it gets interesting: what if we use AI to analyze logs and automatically make rollout decisions?
The AI-Powered Analysis Plugin
I developed a plugin for Argo Rollouts that uses Large Language Models (specifically Google’s Gemini) to analyze deployment logs and make intelligent decisions about whether to promote or rollback a deployment. The workflow is:
Log Collection: Gather logs from stable and canary versions
AI Analysis: Send logs to an LLM with a structured prompt
Decision Making: The AI responds with a promote/rollback recommendation and confidence level
Automated Action: Argo Rollouts automatically promotes or rolls back based on the AI’s decision
The prompt asks the LLM to:
Analyze canary behavior compared to the stable version
Respond in JSON format with a boolean promotion decision
Provide a confidence level (0-100%)
For example, if the confidence threshold is set to 50%, any recommendation with confidence above 50% is executed automatically.
The Complete Self-Healing Loop
But we can go further. When a rollout fails and rolls back, the plugin automatically:
Creates a GitHub Issue: The LLM generates an appropriate title and detailed description of the problem, including log analysis and recommended fixes
Assigns a Coding Agent: Labels the issue to trigger agents like Jules, GitHub Copilot, or similar tools
Automatic Fix: The coding agent analyzes the issue, creates a fix, and submits a pull request
Continuous Loop: Once merged, the new version goes through the same rollout process
Live Demo Results
In my live demonstration, I showed this complete workflow in action:
Successful Deployment: When deploying a working version (changing from “blue” to “green”), the rollout progressed smoothly through the defined steps (20%, 40%, 60%, 80%, 100%) at 10-second intervals. The AI analyzed the logs and determined: “The stable version consistently returns 100 blue, the canary version returns 100 green, both versions return 200 status codes. Based on the logs, the canary version seems stable.”
Failed Deployment: When deploying a broken version that returned random colors and threw panic errors, the system:
Detected the issue during the canary phase
Automatically rolled back to the stable version
The AI analysis identified: “The canary version returns a mix of colors (purple, blue, green, orange, yellow) along with several panic errors due to runtime error index out of range with length zero”
Provided a confidence level of 95% that the deployment should not be promoted
Automatically created a GitHub issue with detailed analysis
Assigned the issue to Jules (coding agent)
Within 3-5 minutes, received a pull request with a fix
The coding agents (I demonstrated both Jules and GitHub Copilot) analyzed the code, identified the problem in the getColor() function, fixed the bug, added tests, and created well-documented pull requests with proper commit messages.
Inline Mode: The plugin directly calls the LLM, makes decisions, and creates GitHub issues
Agent Mode: Uses agent-to-agent (A2A) communication to call specialized agents with domain-specific knowledge and tools
The native mode is particularly powerful because you can build agents that understand your specific problem space, with access to internal databases, monitoring tools, or other specialized resources.
The Future of Self-Healing Systems
This approach demonstrates the practical application of AI agents in production environments. The key insight is creating a continuous feedback loop:
Deploy changes progressively
Automatically detect issues
Roll back when necessary
Generate detailed issue reports
Let AI agents propose fixes
Review and merge fixes
Repeat
The beauty of this system is that it works continuously. You can have multiple issues being addressed simultaneously by different agents, working 24/7 to keep your systems healthy. As humans, we just need to review and ensure the proposed fixes align with our intentions.
Practical Considerations
While this technology is impressive, it’s important to note:
AI isn’t perfect: The agents don’t always get it right on the first try (as demonstrated when the AI ignored my instruction about color variations)
Human oversight is still crucial: Review pull requests before merging
Start simple: Begin with basic metrics before adding AI analysis
Tune your confidence thresholds: Adjust based on your risk tolerance
Monitor the monitors: Ensure your analysis systems are reliable
Getting Started
If you want to implement similar systems:
Start with Argo Rollouts: Learn basic canary deployments without AI
Implement analysis: Use Prometheus or custom jobs for analysis
Add AI gradually: Experiment with AI analysis for non-critical deployments
Build the feedback loop: Integrate issue creation and coding agents
Iterate and improve: Refine your prompts and confidence thresholds
Conclusion
Progressive delivery isn’t new, but combining it with agentic AI creates powerful new possibilities for self-healing systems. While we’re not at full autonomous production management yet, we’re getting closer. The technology exists today to automatically detect, analyze, and fix many production issues without human intervention.
As I showed in the demo, you can literally watch the system detect a problem, roll back automatically, create an issue, and have a fix ready for review—all while you’re having coffee. That’s the future I want to work toward: systems that heal themselves and learn from their mistakes.
Jenkinsfile-Runner-Google-Cloud-Run project is a Google Cloud Run (a container native, serverless platform) Docker image to run Jenkins pipelines. It will process a GitHub webhook, git clone the repository and execute the Jenkinsfile in that git repository. It allows high scalability and pay per use with zero cost if not used.
This image allows Jenkinsfile execution without needing a persistent Jenkins master running in the same way as Jenkins X Serverless, but using the Google Cloud Run platform instead of Kubernetes.
The image is similar to the other ones. The main difference between Lambda and Google Cloud Run is in the packaging, as Lambda layers are limited in size and are expanded in /opt while Google Cloud Run allows any custom Dockerfile where you can install whatever you want in a much easier way.
This image is extending the Jenkinsfile Runner image instead of doing a Maven build with it as a dependency as it simplifies classpath magement.
Limitations
Max build duration is 15 minutes but we can use a timeout value up tos 60 minutes by using gcloud beta.
Current implementation limitations:
checkout scm does not work, change it to sh 'git clone https://github.com/carlossg/jenkinsfile-runner-example.git'
You can add your plugins to plugins.txt. You could also add the Configuration as Code plugin for configuration, example at jenkins.yaml.
Other tools can be added to the Dockerfile.
Installation
GitHub webhooks execution will time out if the call takes too long, so we also create a nodejs Google function (index.js) that forwards the request to Google Cloud Run and returns the response to GitHub while the build runs.
While testing Jenkins X I hit an issue that puzzled me. I use Kaniko to build Docker images and push them into Google Container Registry. But the push to GCR was failing with
INFO[0000] Taking snapshot of files...

error pushing image: failed to push to destination gcr.io/myprojectid/croc-hunter:1: DENIED: Token exchange failed for project 'myprojectid'. Caller does not have permission 'storage.buckets.get'. To configure permissions, follow instructions at: https://cloud.google.com/container-registry/docs/access-control
During installation Jenkins X creates a GCP Service Account based on the name of the cluster (in my case jx-rocks) called jxkaniko-jx-rocks with roles:
roles/storage.admin
roles/storage.objectAdmin
roles/storage.objectCreator
More roles are added if you install Jenkins X with Vault enabled.
A key is created for the service account and added to Kubernetes as secrets/kaniko-secret containing the service account key json, which is later on mounted in the pods running Kaniko as described in their instructions.
After looking and looking the service account and roles they all seemed correct in the GCP console, but the Kaniko build was still failing. I found a stackoverflow post claiming that the permissions were cached if you had a previous service account with the same name (WAT?), so I tried with a new service account with same permissions and different name and that worked. Weird. So I created a script to replace the service account by another one and update the Kubernetes secret.
ACCOUNT=jxkaniko-jx-rocks
PROJECT_ID=myprojectid

# delete the existing service account and policy binding
gcloud -q iam service-accounts delete ${ACCOUNT}@${PROJECT_ID}.iam.gserviceaccount.com
gcloud -q projects remove-iam-policy-binding ${PROJECT_ID} --member=serviceAccount:${ACCOUNT}@${PROJECT_ID}.iam.gserviceaccount.com --role roles/storage.admin
gcloud -q projects remove-iam-policy-binding ${PROJECT_ID} --member=serviceAccount:${ACCOUNT}@${PROJECT_ID}.iam.gserviceaccount.com --role roles/storage.objectAdmin
gcloud -q projects remove-iam-policy-binding ${PROJECT_ID} --member=serviceAccount:${ACCOUNT}@${PROJECT_ID}.iam.gserviceaccount.com --role roles/storage.objectCreator

# create a new one
gcloud -q iam service-accounts create ${ACCOUNT} --display-name ${ACCOUNT}
gcloud -q projects add-iam-policy-binding ${PROJECT_ID} --member=serviceAccount:${ACCOUNT}@${PROJECT_ID}.iam.gserviceaccount.com --role roles/storage.admin
gcloud -q projects add-iam-policy-binding ${PROJECT_ID} --member=serviceAccount:${ACCOUNT}@${PROJECT_ID}.iam.gserviceaccount.com --role roles/storage.objectAdmin
gcloud -q projects add-iam-policy-binding ${PROJECT_ID} --member=serviceAccount:${ACCOUNT}@${PROJECT_ID}.iam.gserviceaccount.com --role roles/storage.objectCreator

# create a key for the service account and update the secret in Kubernetes
gcloud -q iam service-accounts keys create kaniko-secret --iam-account=${ACCOUNT}@${PROJECT_ID}.iam.gserviceaccount.com
kubectl create secret generic kaniko-secret --from-file=kaniko-secret
And it did also work, so no idea why it was failing, but at least I’ll remember now how to manually cleanup and recreate the service account.
The Jenkinsfile-Runner-Fn project is a Fn Project (a container native, cloud agnostic serverless platform) function to run Jenkins pipelines. It will process a GitHub webhook, git clone the repository and execute the Jenkinsfile in that git repository. It allows scalability and pay per use with zero cost if not used.
This function allows Jenkinsfile execution without needing a persistent Jenkins master running in the same way as Jenkins X Serverless, but using the Fn Project platform (and supported providers like Oracle Functions) instead of Kubernetes.
Fn Project vs AWS Lambda
The function is very similar to the one in jenkinsfile-runner-lambda with just a small change in the signature. The main difference between Lambda and Fn is in the packaging, as Lambda layers are limited in size and are expanded in /optwhile Fn allows a custom Dockerfile where you can install whatever you want in a much easier way, just need to include the function code and entrypoint from fnproject/fn-java-fdk.
Oracle Functions
Oracle Functions is a cloud service providing Project Fn function execution (currently in limited availability). jenkinsfile-runner-fn function runs in Oracle Functions, with the caveat that it needs a syslog server running somewhere to get the logs (see below).
Limitations
Current implementation limitations:
checkout scm does not work, change it to sh 'git clone https://github.com/carlossg/jenkinsfile-runner-fn-example.git'
Jenkinsfile must use /tmp for any tool that needs writing files, see the example
The Jenkinsfile-Runner-Lambda project is a AWS Lambda function to run Jenkins pipelines. It will process a GitHub webhook, git clone the repository and execute the Jenkinsfile in that git repository. It allows huge scalability with 1000+ concurrent builds and pay per use with zero cost if not used.
This function allows Jenkinsfile execution without needing a persistent Jenkins master running in the same way as Jenkins X Serverless, but using AWS Lambda instead of Kubernetes. All the logs are stored in AWS CloudWatch and are easily accessible.
Why???
Why not?
I mean, it could make sense to run Jenkinsfiles in Lambda when you are building AWS related stuff, like creating an artifact and uploading it to S3.
Limitations
Lambda limitations:
15 minutes execution time
3008MB of memory
git clone and generated artifacts must fit in the 500MB provided
Current implementation limitations:
checkout scm does not work, change it to sh 'git clone https://github.com/carlossg/jenkinsfile-runner-lambda-example.git'
Jenkinsfile must add /usr/local/bin to PATH and use /tmp for any tool that needs writing files, see the example
Extending
Three lambda layers are created:
jenkinsfile-runner: the main library
plugins: minimal set of plugins to build a Jenkinsfile
tools: git, openjdk, maven
You can add your plugins in a new layer as a zip file inside a plugins dir to be expanded in /opt/plugins. You could also add the Configuration as Code plugin and configure the Artifact Manager S3 to store all your artifacts in S3.
Other tools can be added as new layers, and they will be expanded in /opt. You can find a list of scripts for inspiration in the lambci project (gcc,go,java,php,python,ruby,rust) and bash, git and zip (git is already included in the tools layer here)
The layers are built with Docker, installing jenkinsfile-runner, tools and plugins under /opt which is where Lambda layers are expanded. These files are then zipped for upload to Lambda.
Installation
Create a lambda function jenkinsfile-runner using Java 8 runtime. Use the layers built in target/layer-* and target/jenkinsfile-runner-lambda-*.jar as function. Could use make publish to create them.
From the lambda function configuration page add a API Gateway trigger. Select Create a new API and choose the security level. Save the function and you will get a http API endpoint.
Note that to achieve asynchronous execution (GitHub webhooks execution will time out if your webhook takes too long) you would need to configure API Gateway to send the payload to SNS and then lambda to listen to SNS events. See an example.
GitHub events
Add a GitHub json webhook to your git repo pointing to the lambda api gateway url.
Several interesting announcements from last week Google Next conference.
Knative, a new OSS project built by Google, Red Hat, IBM,… to build, deploy, and manage modern serverless workloads on Kubernetes. Built upon Istio, with 1.0 coming soon and managed Istio on GCP. It includes a build primitive to manage source to kubernetes flows, that can be used independently. Maybe it is the new standard to define sources and builds in Kubernetes. Read more from Mark Chmarny.
GKE on premise, a Google-configured version of Kubernetes with multi-cluster management, running on top of VMware’s vSphere.
Another Kubernetes related mention was the gVisor pod sandbox, with experimental support for Kubernetes, to allow running sandboxed containers in a Kubernetes cluster. Very interesting for multi-tenant clusters and docker image builds.
Serverless containers allow you to run container-based workloads in a fully managed environment and still only pay for what you use. Sign up for an early preview of serverless containers on Cloud Functions to run your own containerized functions on GCP with all the benefits of serverless.
A new GKE serverless add-on lets you run serverless workloads on Kubernetes Engine with a one-step deploy. You can go from source to containers instantaneously, auto-scale your stateless container-based workloads, and even scale down to zero.
Cloud Build, a fully-managed CI/CD platform that lets you build and test applications in the cloud. With an interesting approach where all the pipeline steps are containers themselves so it is reasonably easy to extend. It integrates with GitHub for repos with a Dockerfile (let’s see if it lasts long after Microsoft acquisition).
Other interesting announcements include:
Edge TPU, a tiny ASIC chip designed to run TensorFlow Lite ML models at the edge.
Titan Security Key, a FIDO security key with firmware developed by Google. Google security was giving away at the conference both NFC and bluetooth keys, a good replacement for the yubikeys specially for mobile devices.


 While testing
  The
The  The
The 
 Several interesting announcements from last week Google Next conference.
 Carlos Sanchez's Weblog