Rolling out changes to all users at once in production is risky—we’ve all learned this lesson at some point. But what if we could combine progressive delivery techniques with AI agents to automatically detect, analyze, and fix deployment issues? In this article, I’ll show you how to implement self-healing rollouts using Argo Rollouts and agentic AI to create a fully automated feedback loop that can fix production issues while you grab a coffee.
The Case for Progressive Delivery
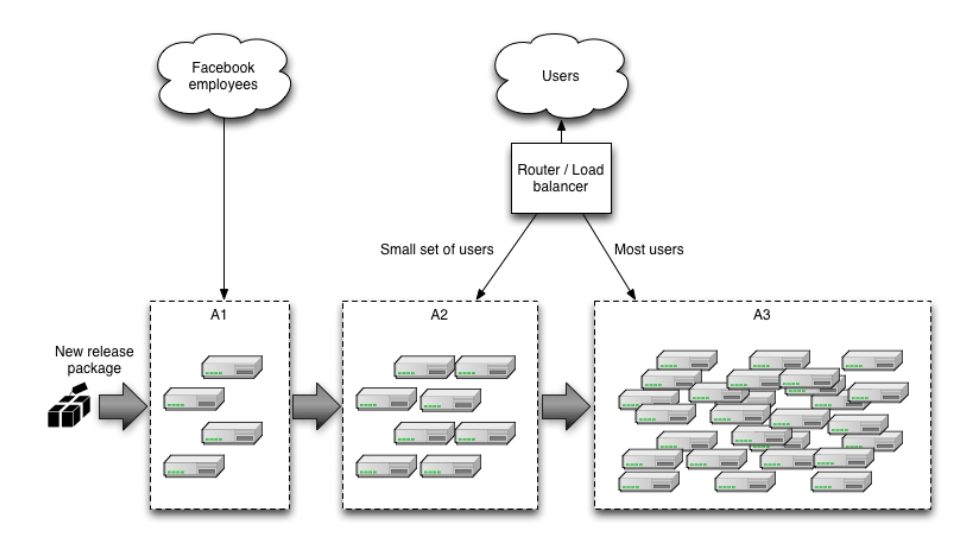
Progressive Delivery is a term that encompasses deployment strategies designed to avoid the pitfalls of all-or-nothing deployments. The concept gained significant attention after the CrowdStrike incident, where a faulty update took down a substantial portion of the internet. Their post-mortem revealed a crucial lesson: they should have deployed to progressive “rings” or “waves” of customers, with time between deployments to gather metrics and telemetry.
The key principles of progressive delivery are:
- Avoiding downtime: Deploy changes gradually with quick rollback capabilities
- Limiting the blast radius: Only a small percentage of users are affected if something goes wrong
- Shorter time to production: Safety nets enable faster, more confident deployments
As I like to say: “If you haven’t automatically destroyed something by mistake, you’re not automating enough.”
Progressive Delivery Techniques
Rolling Updates
Kubernetes provides rolling updates by default. As new pods come up, old pods are gradually deleted, automatically shifting traffic to the new version. If issues arise, you can roll back quickly, affecting only the percentage of traffic that hit the new pods during the update window.
Blue-Green Deployment
This technique involves deploying a complete copy of your application (the “blue” version) alongside the existing production version (the “green” version). After testing, you switch all traffic to the new version. While this provides quick rollbacks, it requires twice the resources and switches all traffic at once, potentially affecting all users before you can react.
Canary Deployment
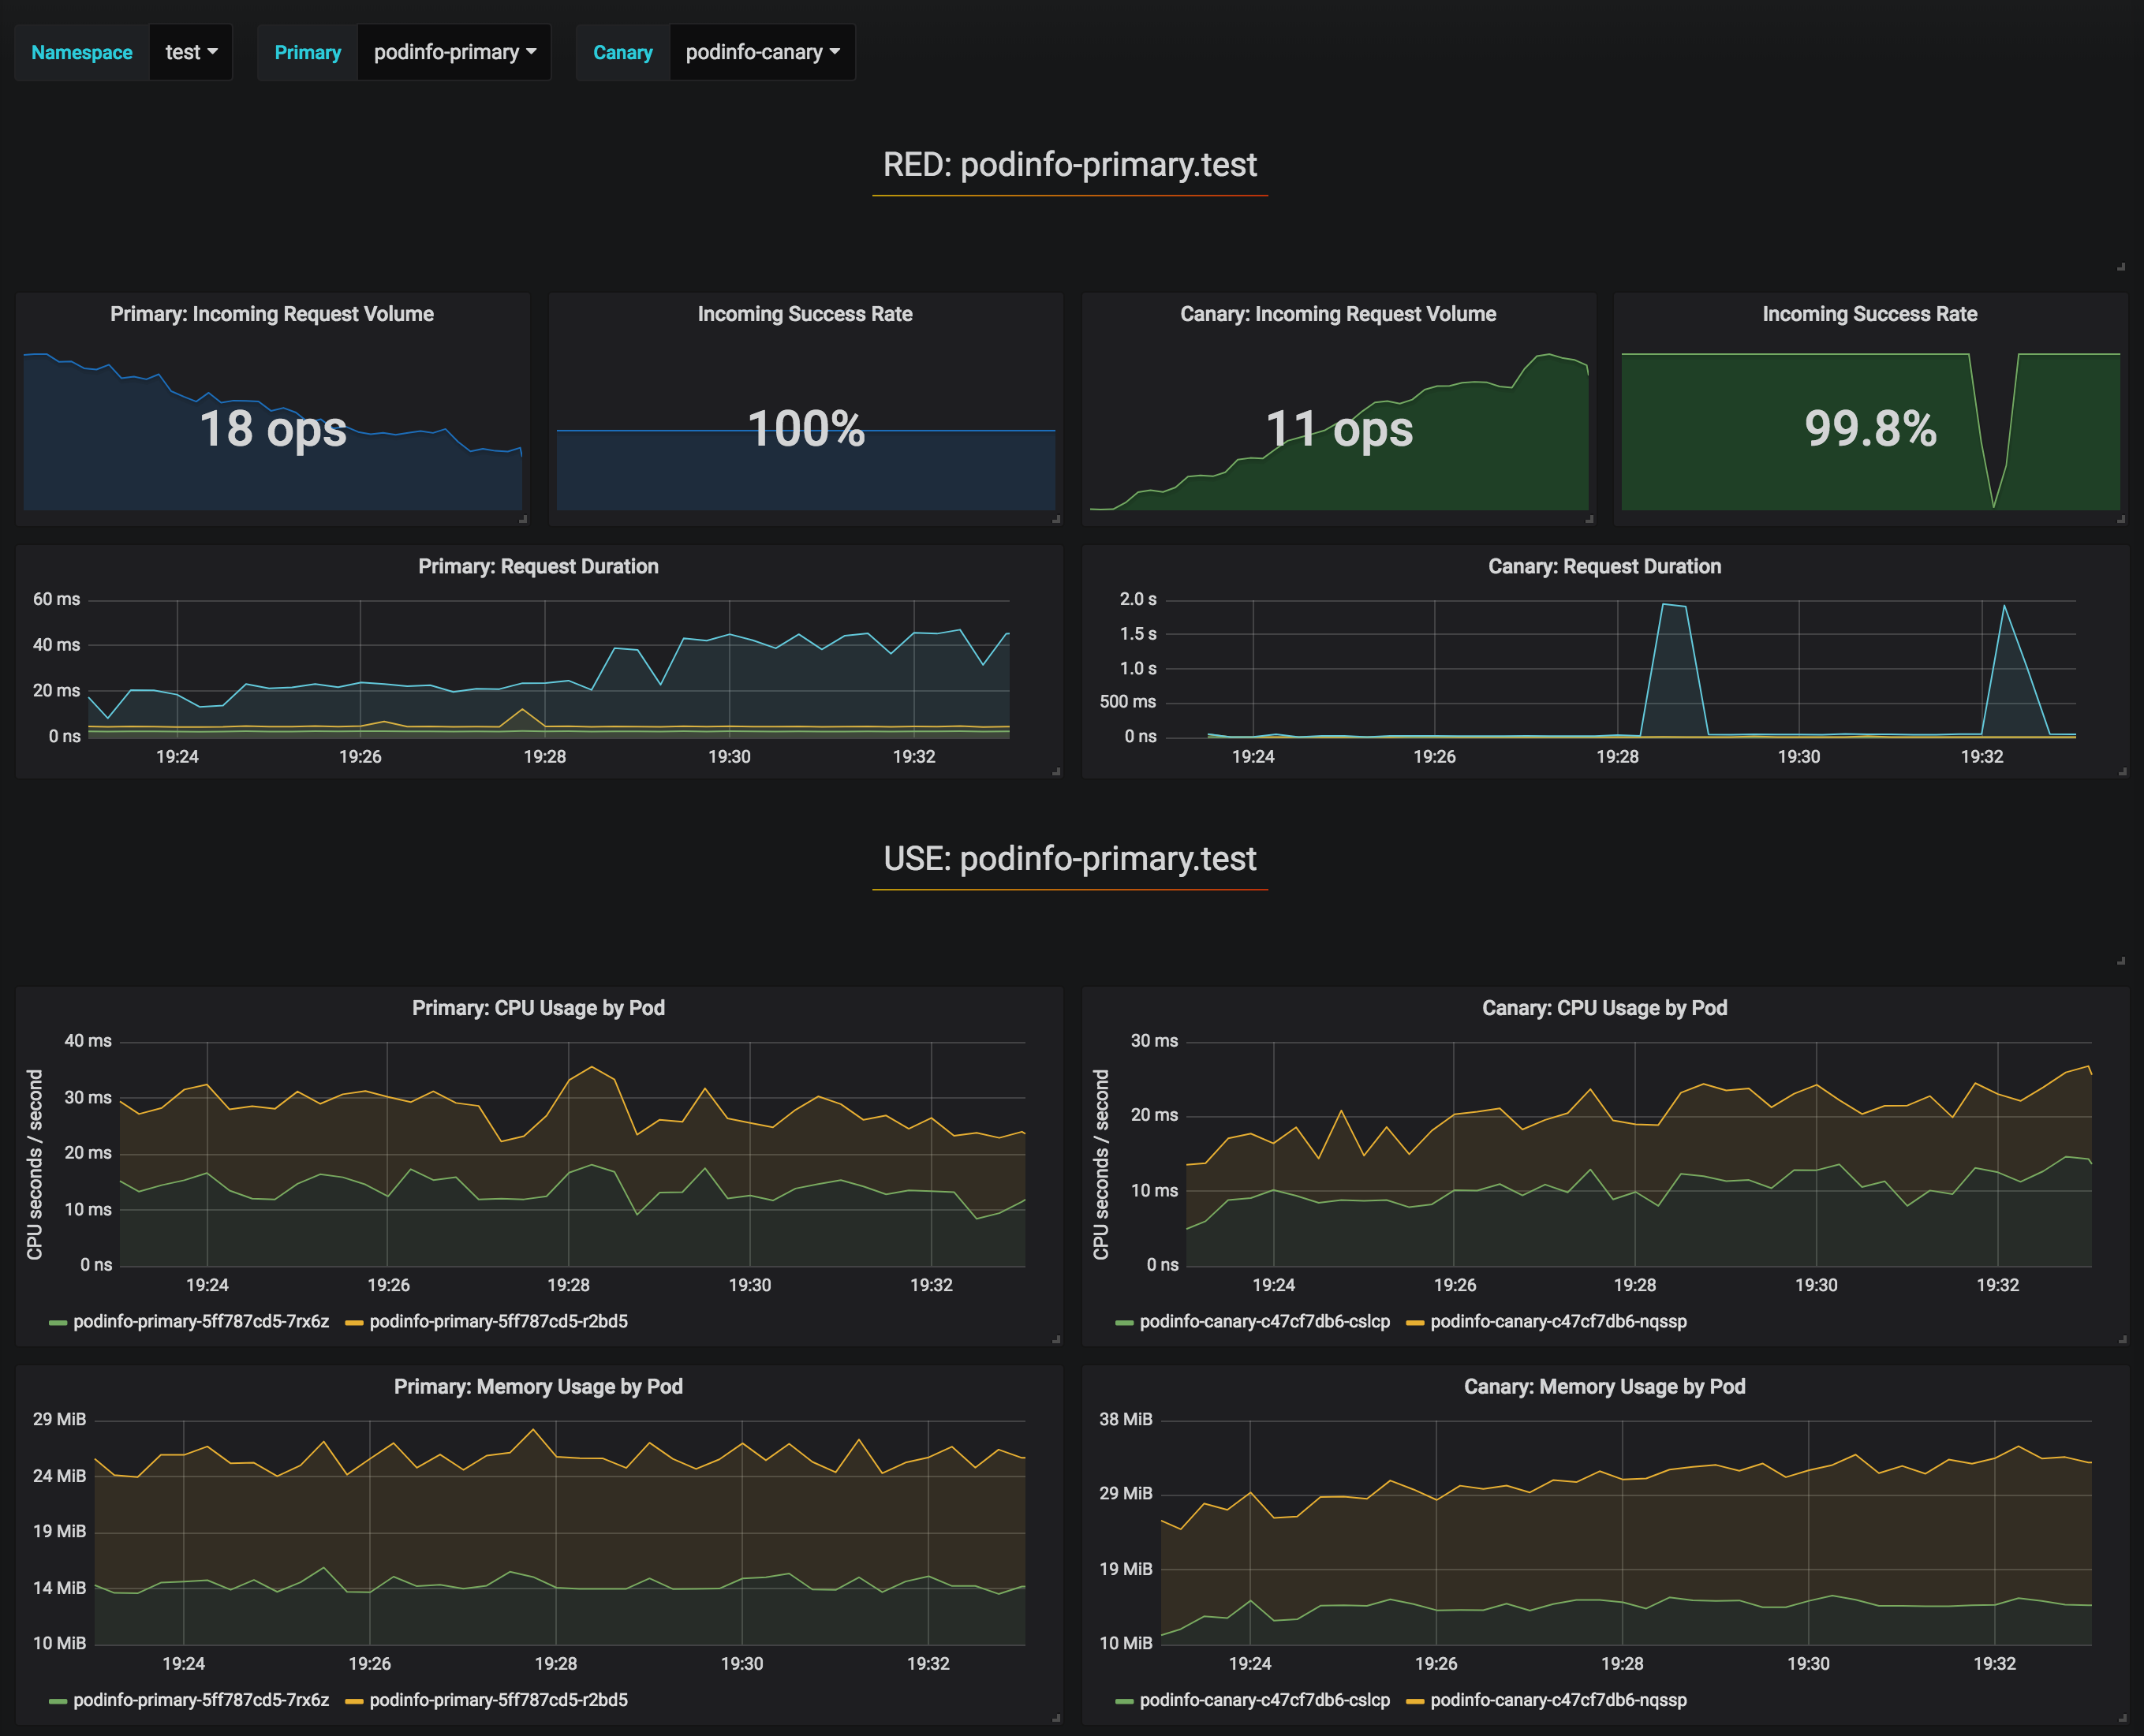
Canary deployments offer more granular control. You deploy a new version alongside the stable version and gradually increase the percentage of traffic going to the new version—perhaps starting with 5%, then 10%, and so on. You can route traffic based on various parameters: internal employees, IP ranges, or random percentages. This approach allows you to detect issues early while minimizing user impact.
Feature Flags
Feature flags provide even more granular control at the application level. You can deploy code with new features disabled by default, then enable them selectively for specific user groups. This decouples deployment from feature activation, allowing you to:
- Ship faster without immediate risk
- Enable features for specific customers or user segments
- Quickly disable problematic features without redeployment
You can implement feature flags using dedicated services like OpenFeature or simpler approaches like environment variables.
Progressive Delivery in Kubernetes
Kubernetes provides two main architectures for traffic routing:
Service Architecture
The traditional approach uses load balancers directing traffic to services, which then route to pods based on labels. This works well for basic scenarios but lacks flexibility for advanced routing.
Ingress Architecture
The Ingress layer provides more sophisticated traffic management. You can route traffic based on domains, paths, headers, and other criteria, enabling fine-grained control essential for canary deployments. Popular ingress controllers include:
Enter Argo Rollouts
Argo Rollouts is a Kubernetes controller that provides advanced deployment capabilities including blue-green deployments, canary releases, analysis, and experimentation. It’s a powerful tool for implementing progressive delivery in Kubernetes environments.
How Argo Rollouts Works
The architecture includes:
- Rollout Controller: Manages the deployment process
- Rollout Object: Defines the deployment strategy and analysis configuration
- Analysis Templates: Specify metrics and success criteria
- Replica Sets: Manages stable and canary versions with automatic traffic shifting
When you update a Rollout, it creates separate replica sets for stable and canary versions, gradually increasing canary pods while decreasing stable pods based on your defined rules. If you’re using a service mesh or advanced ingress, you can implement fine-grained routing—sending specific headers, paths, or user segments to the canary version.
Analysis Options
Argo Rollouts supports various analysis methods:
- Prometheus: Query metrics to determine rollout health
- Datadog: Integration with Datadog monitoring
- Kubernetes Jobs: Run custom analysis logic—check databases, call APIs, or perform any custom validation
The experimentation feature is particularly interesting. We considered using it to test Java upgrades: deploy a new Java version, run it for a few hours gathering metrics on response times and latency, then decide whether to proceed with the full rollout—all before affecting real users.
Adding AI to the Mix
Now, here’s where it gets interesting: what if we use AI to analyze logs and automatically make rollout decisions?
The AI-Powered Analysis Plugin
I developed a plugin for Argo Rollouts that uses Large Language Models (specifically Google’s Gemini) to analyze deployment logs and make intelligent decisions about whether to promote or rollback a deployment. The workflow is:
- Log Collection: Gather logs from stable and canary versions
- AI Analysis: Send logs to an LLM with a structured prompt
- Decision Making: The AI responds with a promote/rollback recommendation and confidence level
- Automated Action: Argo Rollouts automatically promotes or rolls back based on the AI’s decision
The prompt asks the LLM to:
- Analyze canary behavior compared to the stable version
- Respond in JSON format with a boolean promotion decision
- Provide a confidence level (0-100%)
For example, if the confidence threshold is set to 50%, any recommendation with confidence above 50% is executed automatically.
The Complete Self-Healing Loop
But we can go further. When a rollout fails and rolls back, the plugin automatically:
- Creates a GitHub Issue: The LLM generates an appropriate title and detailed description of the problem, including log analysis and recommended fixes
- Assigns a Coding Agent: Labels the issue to trigger agents like Jules, GitHub Copilot, or similar tools
- Automatic Fix: The coding agent analyzes the issue, creates a fix, and submits a pull request
- Continuous Loop: Once merged, the new version goes through the same rollout process
Live Demo Results
In my live demonstration, I showed this complete workflow in action:
Successful Deployment: When deploying a working version (changing from “blue” to “green”), the rollout progressed smoothly through the defined steps (20%, 40%, 60%, 80%, 100%) at 10-second intervals. The AI analyzed the logs and determined: “The stable version consistently returns 100 blue, the canary version returns 100 green, both versions return 200 status codes. Based on the logs, the canary version seems stable.”
Failed Deployment: When deploying a broken version that returned random colors and threw panic errors, the system:
- Detected the issue during the canary phase
- Automatically rolled back to the stable version
- The AI analysis identified: “The canary version returns a mix of colors (purple, blue, green, orange, yellow) along with several panic errors due to runtime error index out of range with length zero”
- Provided a confidence level of 95% that the deployment should not be promoted
- Automatically created a GitHub issue with detailed analysis
- Assigned the issue to Jules (coding agent)
- Within 3-5 minutes, received a pull request with a fix
The coding agents (I demonstrated both Jules and GitHub Copilot) analyzed the code, identified the problem in the getColor() function, fixed the bug, added tests, and created well-documented pull requests with proper commit messages.
Technical Implementation
The Rollout Configuration
apiVersion: argoproj.io/v1alpha1
kind: Rollout
metadata:
  name: canary-demo
spec:
  strategy:
    canary:
      analysis:
        templates:
          - templateName: canary-analysis-ai
The Analysis Template
The template configures the AI plugin to check every 10 seconds and require a confidence level above 50% for promotion:
apiVersion: argoproj.io/v1alpha1
kind: AnalysisTemplate
metadata:
  name: canary-analysis-ai
spec:
  metrics:
    - name: success-rate
      interval: 10s
      successCondition: result > 0.50
      provider:
        plugin:
          argoproj-labs/metric-ai:
            model: gemini-2.0-flash
            githubUrl: https://github.com/carlossg/rollouts-demo
            extraPrompt: |
              Ignore color changes.
Agent-to-Agent Communication
The plugin supports two modes:
- Inline Mode: The plugin directly calls the LLM, makes decisions, and creates GitHub issues
- Agent Mode: Uses agent-to-agent (A2A) communication to call specialized agents with domain-specific knowledge and tools
The native mode is particularly powerful because you can build agents that understand your specific problem space, with access to internal databases, monitoring tools, or other specialized resources.
The Future of Self-Healing Systems
This approach demonstrates the practical application of AI agents in production environments. The key insight is creating a continuous feedback loop:
- Deploy changes progressively
- Automatically detect issues
- Roll back when necessary
- Generate detailed issue reports
- Let AI agents propose fixes
- Review and merge fixes
- Repeat
The beauty of this system is that it works continuously. You can have multiple issues being addressed simultaneously by different agents, working 24/7 to keep your systems healthy. As humans, we just need to review and ensure the proposed fixes align with our intentions.
Practical Considerations
While this technology is impressive, it’s important to note:
- AI isn’t perfect: The agents don’t always get it right on the first try (as demonstrated when the AI ignored my instruction about color variations)
- Human oversight is still crucial: Review pull requests before merging
- Start simple: Begin with basic metrics before adding AI analysis
- Tune your confidence thresholds: Adjust based on your risk tolerance
- Monitor the monitors: Ensure your analysis systems are reliable
Getting Started
If you want to implement similar systems:
- Start with Argo Rollouts: Learn basic canary deployments without AI
- Implement analysis: Use Prometheus or custom jobs for analysis
- Add AI gradually: Experiment with AI analysis for non-critical deployments
- Build the feedback loop: Integrate issue creation and coding agents
- Iterate and improve: Refine your prompts and confidence thresholds
Conclusion
Progressive delivery isn’t new, but combining it with agentic AI creates powerful new possibilities for self-healing systems. While we’re not at full autonomous production management yet, we’re getting closer. The technology exists today to automatically detect, analyze, and fix many production issues without human intervention.
As I showed in the demo, you can literally watch the system detect a problem, roll back automatically, create an issue, and have a fix ready for review—all while you’re having coffee. That’s the future I want to work toward: systems that heal themselves and learn from their mistakes.

 Alibaba Cloud has a managed


